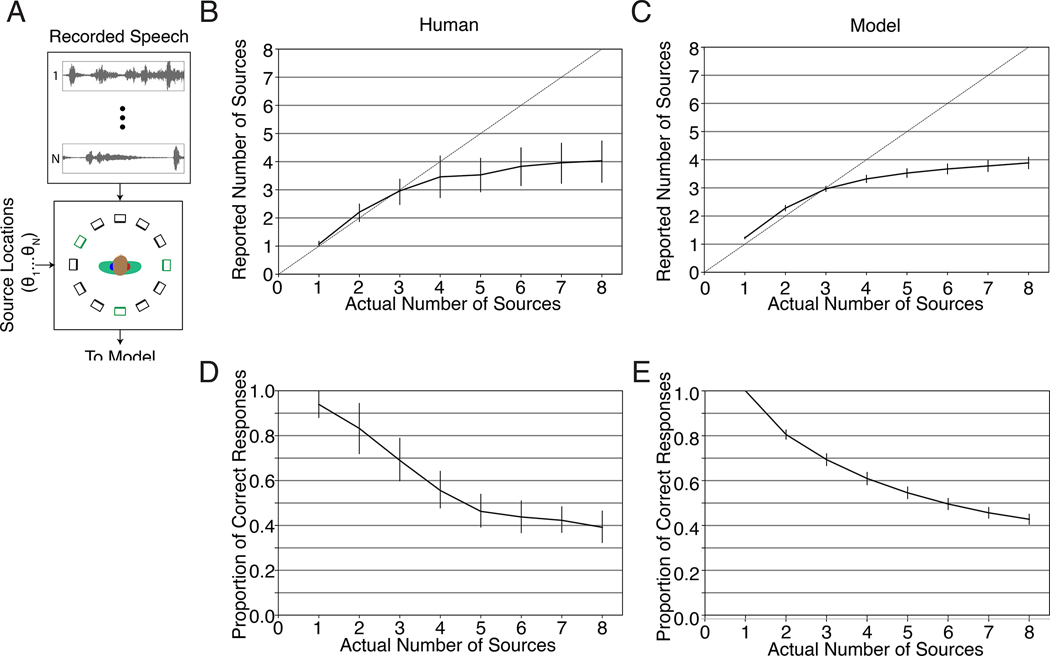
Figure 6.
Multi-source localization. A. Diagram of experiment. On each trial, between 1 and 8 speech signals (each spoken by a different talker) was played from a subset of the speakers in a 12-speaker circular array. The lower panel depicts an example trial in which three speech signals were presented, with the corresponding speakers in green. Participants reported the number of sources and their locations. B. Average number of sources reported by human listeners, plotted as a function of the actual number of sources. Error bars plot standard deviation across participants. Here and in D, graph is reproduced from original paper98 with permission of the authors. C. Same as B, but for the model. Error bars plot standard deviation across the 10 networks D. Localization accuracy (measured as the proportion of sources correctly localized to the actual speaker from which they were presented), plotted as a function of the number of sources. Error bars plot standard deviation across participants. E. Same as D, but for the model. Error bars plot standard deviation across the 10 networks.

