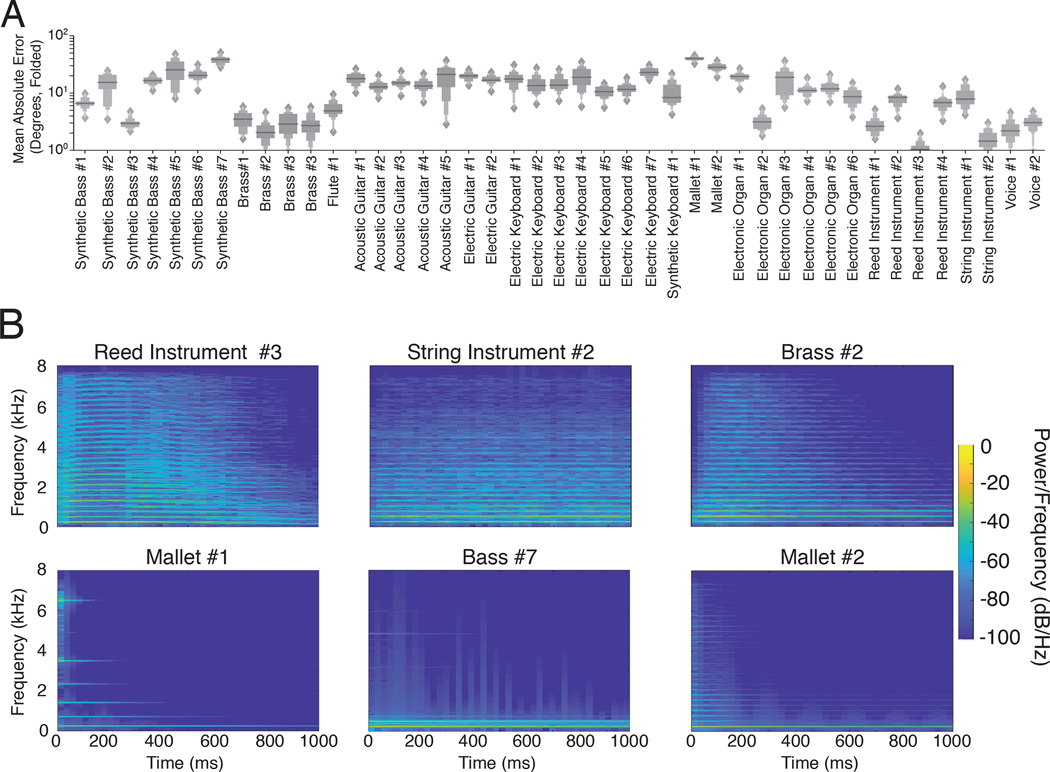
Figure 8.
Model localization accuracy for musical instrument sounds. A. Mean model localization error for each of 43 musical instruments. Each of a set of instrument notes was rendered at randomly selection locations. Graph shows letter-value plots157 of the mean localization error across notes, measured after actual and judged positions were front-back folded. Letter-value plots are boxplots with additional quantiles. The widest box depicts the middle two quartiles (1/4) of the data distribution, as in a box plot, the second widest box depicts the next two octiles (1/8), the third widest box depicts the next two hexadeciles (1/16), etc., up to the upper and lower 1/64 quantiles. Horizontal line plots median value and diamonds denote outliers. B. Spectrograms of example note (middle C) for the three most and least accurately localized instruments (top and bottom, respectively).

