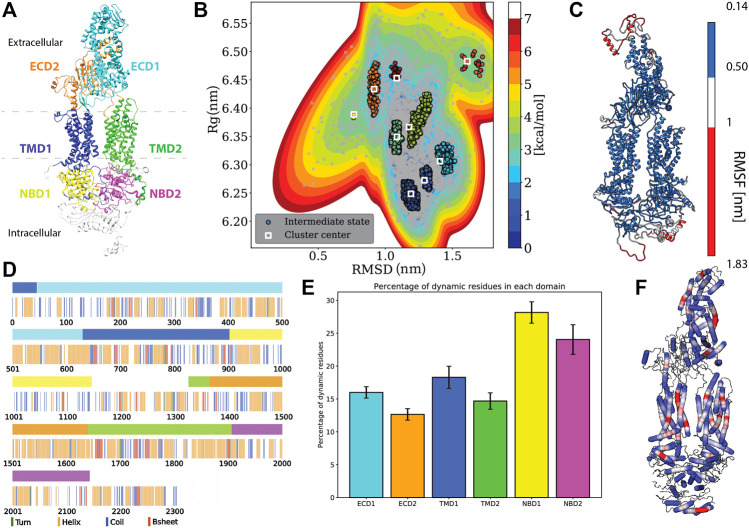
FIGURE 1.
Protein specific analysis. (A) Domain assignment of ABCA1 (according to Qian et al., 2017) (B). Free energy estimation and clustering showing distinct minima bins (C). Root mean square fluctuation (RMSF) mapped onto the protein that showed the extremities of the protein being susceptible to large fluctuations. (D) Residue-wise and domain-wise assignment of favoured secondary structure amongst turn (green), helix (orange), coil (blue), b-strands (red) and dynamic residues (white) according to the (A) colour scheme (top bar) (E) Percentage of dynamic residues in each domain, where the color of each bar corresponds to the domains in(A). (F) Degree of flexibility of helices constituting the protein where regions in red indicate areas of highest helix axis angle (>15°) and flexibility, white for intermediate angle magnitudes (0–15°) and blue for angles close to, or at 0°.

