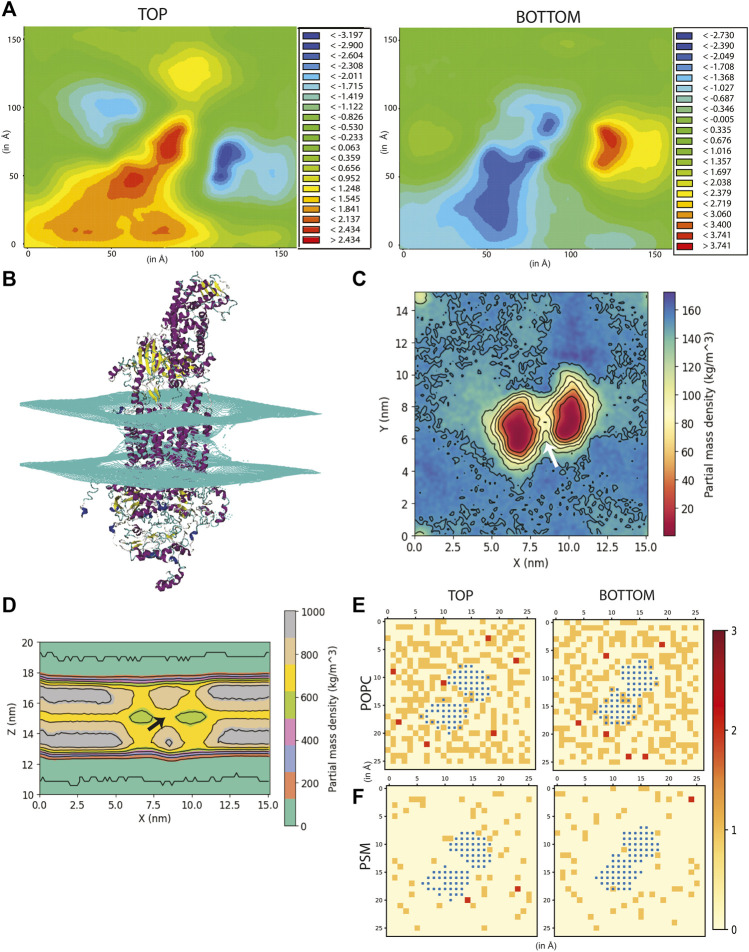
FIGURE 2.
Effect of ABCA1 on membrane curvature and dynamics. (A) Heat maps depicting average membrane thickness of the top and bottom leaflet of the membrane throughout simulation. (B) Curvature induced in the membrane due to presence of protein. Partial density of lipids across two leaflets along (C) XY-plane and (D). XZ-plane. Arrow [colored white and black in (C,D) respectively] depicts the island of lipids within the TMDs. Lipid clustering showing the frequency of lipids (shown as red, orange and cream) of (E). POPC and (F). PSM around protein (colored blue). The membrane is divided into square box of edge 6 Å each and frequency in each of these boxes has been computed and depicted in the figure.

