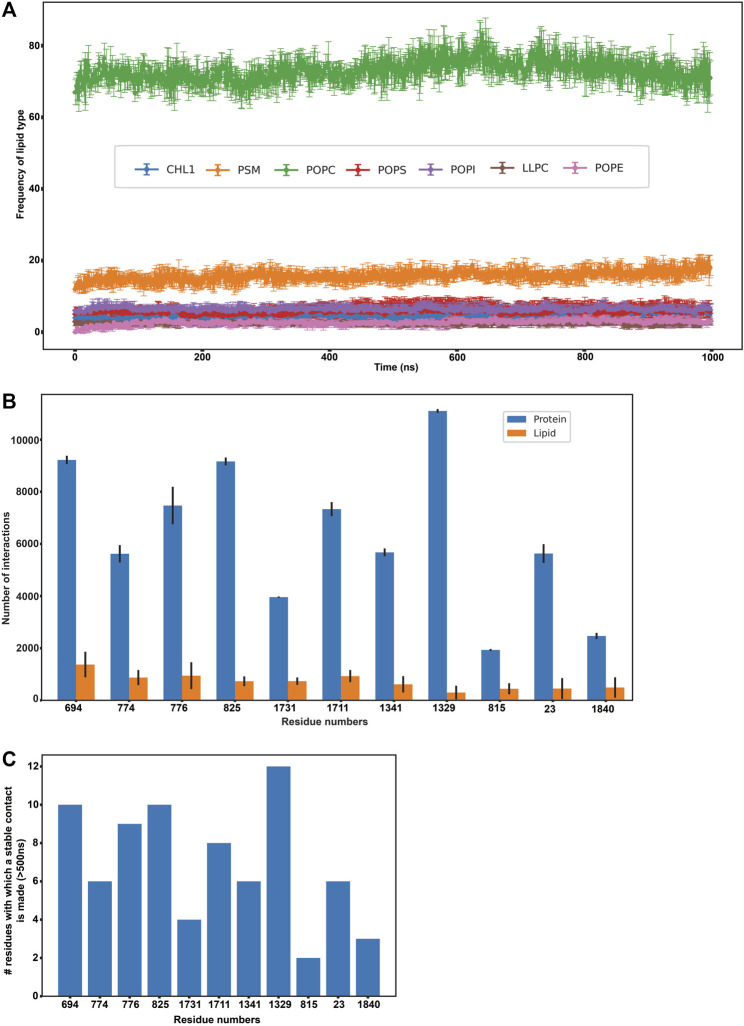
FIGURE 3.
Protein-lipid interactions’ analysis. (A) Frequency of each lipid type surrounding the protein residues within a radius of 0.5 nm throughout our simulation (B) Frequency of protein-protein and protein-lipid interactions of the eleven disease-related protein residues (C) Number of stable protein-protein contacts made by the eleven disease-related protein residues (>500 ns of simulation time).

