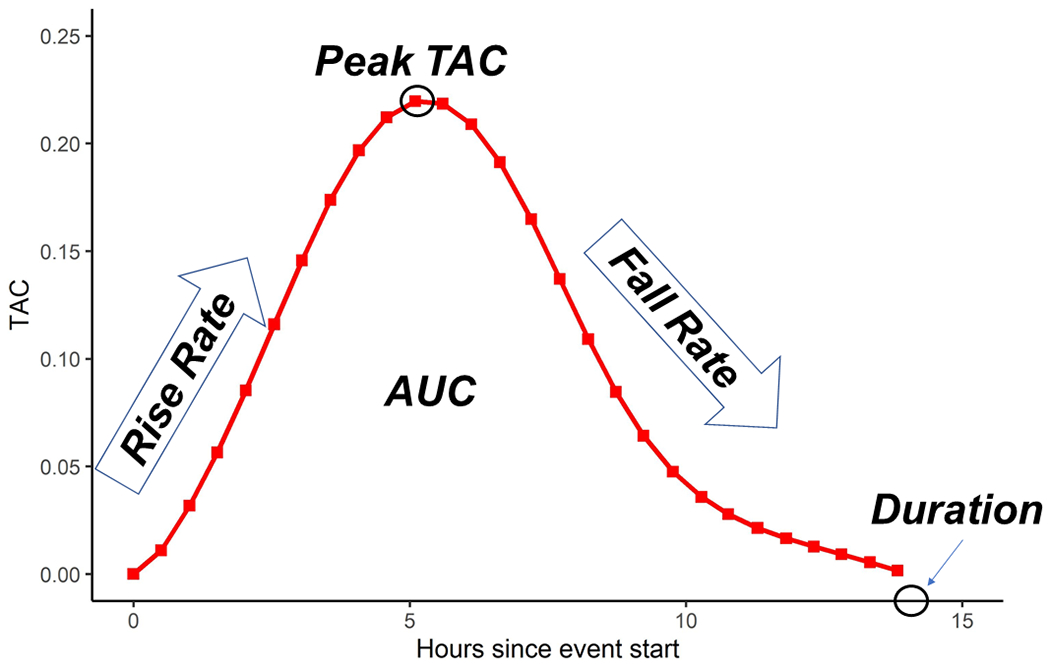
Figure 1.

TAC trajectory from a single episode of actual participant data, illustrating TAC features. Peak is the maximum TAC value. Rise rate is the average point-to-point ascending slope, capturing rate of ethanol absorption. Fall rate is the average point-to-point descending slope, capturing rate of ethanol elimination. Duration is the length of the TAC trajectory, capturing the number of hours under the alcohol concentration curve. Area under the curve (AUC) is the total area under the TAC trajectory, representing estimated cumulative biological alcohol exposure. Drinking reports for this participant included both EMA and next morning retrospective reports: 6 standard drinks were reported as consumed in the episodic EMA for this drinking day, whereas 3 standard drinks were reported in the retrospective morning report.
