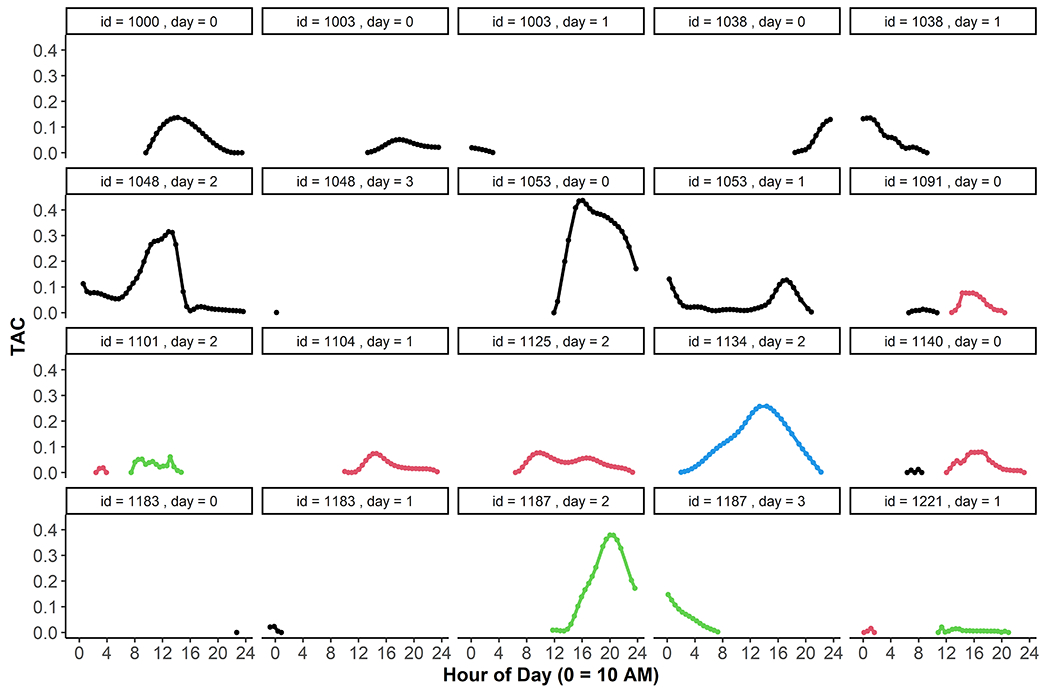
Figure 2.

Single days with TAC event data. Multiple day types are displayed. Some days contained a single TAC event that began and ended within the same day (e.g., id=1000, day=0; id=1104, day=1). Some TAC events spanned more than one day, as indicated by the break across two panels (e.g., id=1038, day=0 and day=1). Some days contained more than one event within the same day, as noted by two distinctly colored curves within the same panel (e.g., id=1091, day=0; id=1101, day=2).
