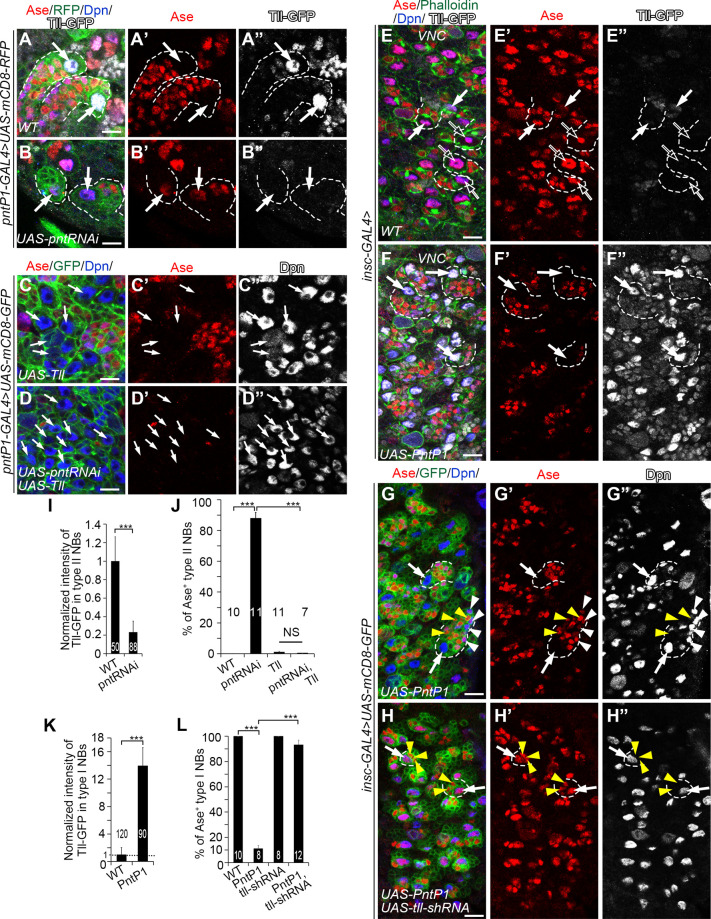
Fig 4. Tll is the PntP1 downstream effector that represses Ase expression in type II NBs.
In all images, white arrows point to some representative type I NBs or type II NBs. Dashed lines outline some type I NB or type II NB lineages. White arrowheads point to some Ase+ Dpn+ mINP-like cells and yellow arrowheads point to some Ase+ Dpn- GMCs as examples. Type II NB lineages in the brain are labeled with mCD8-RFP or mCD8-GFP (in green) driven by pntP1-GAL4 and type I NB lineages in the VNC are labeled with Phalloidin or mCD8-GFP (in green) driven by insc-GAL4. The brains/VNCs are counterstained with anti-Ase (in red), anti-Dpn (in blue) and/or anti-GFP (in white) antibodies. Scale bars equal 10μm. (A-B”) Tll is specifically expressed in wild type type II NBs, which are Ase- (A-A”), while knockdown of PntP1 leads to the abolishment of Tll expression and ectopic Ase expression in type II NBs (B-B”). (C-D”) Expressing UAS-Tll in type II NBs results in generation of supernumerary type II NBs, which are Ase- (C-C”), and knockdown of PntP1 by expressing UAS-pnt RNAi does not lead to ectopic Ase expression in type II NBs when UAS-Tll is expressed simultaneously (D-D”). (E-F”) Wild type type I NBs in the VNC are Ase positive and have no (open arrows) or low levels (white arrows) of Tll-GFP expression at late 3rd instar larval stages (E-E”), while misexpressing UAS-PntP1 activates ectopic Tll-GFP expression in all type I NBs and represses Ase expression (F-F”). (G-H”) Misexpressing UAS-PntP1 suppresses Ase expression in type I NBs in the VNC and induces the generation of Ase+ Dpn+ mINP-like cells (G-G”), whereas simultaneous knockdown of Tll prevents the suppression of Ase and induction of mINP-like cells by PntP1 misexpression (H-H”). (I-J) Quantifications of Tll-GFP intensity in wild type or PntP1 knockdown type II NBs (I), and the percentage of Ase+ type II NBs (J) in the brains with indicated genotypes. Values of the bars are mean ± SD. ***, P < 0.001. NS, not significant. (K-L) Quantifications of Tll-GFP intensity in wild type and PntP1 misexpressing type I NBs (K), and the percentage of Ase+ type I NBs in the VNCs with indicated genotypes (L). Values of the bars are mean ± SD. ***, P < 0.001.

