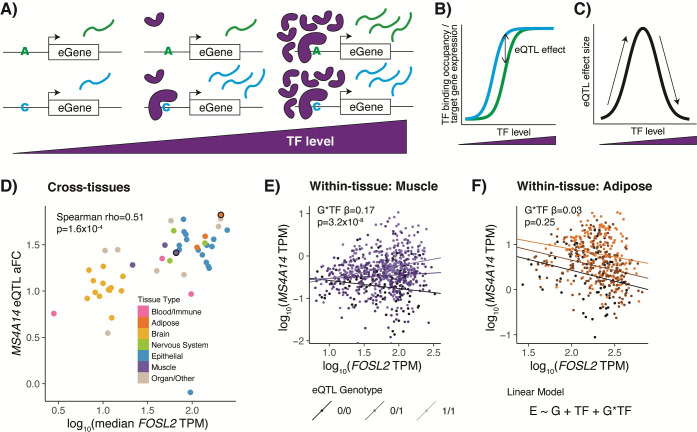
Fig 1. TF model of eQTL effects.
A) TF binding to an eQTL variant with different allelic TF affinities is depicted at low, medium, and high TF levels. B) TF binding occupancy, resulting in target gene expression, for the two eQTL alleles across TF levels. C) Difference in expression of alleles or eQTL effect size, quantified as log2 allelic fold change, across TF levels. Our applied models only examine monotonic effects, which can be imagined as different sides of the hill. D) Tissues are plotted by eQTL effect size vs. median TF expression for an example MS4A14 eQTL and the FOSL2 TF. Cross-tissue TF-eQTL interactions are discovered by a Spearman correlation of these two measures, or with TF protein levels for the protein-based analysis. Two tissues circled in black are highlighted in the following panels. E) & F) Individuals are plotted by eGene expression vs. TF expression in Skeletal Muscle (E) or Adipose Visceral (F) tissue and are shaded by the genotype of the eQTL variant. Within-tissue TF-eQTL interactions are discovered using a multiple linear regression interaction model of normalized eGene expression by TF level, genotype, and TF level by genotype. Linear regression lines are plotted separately for each genotype, with corresponding G*TF interaction beta and p-value displayed on the chart. In Muscle, an eQTL is present, observable as a difference between the genotypes, and the difference gets larger as TF expression is higher, suggesting an interaction between TF level and eQTL effect. In Adipose, an eQTL is present, observable as a difference between the genotypes, but that difference does not appear to correlate with TF level.

