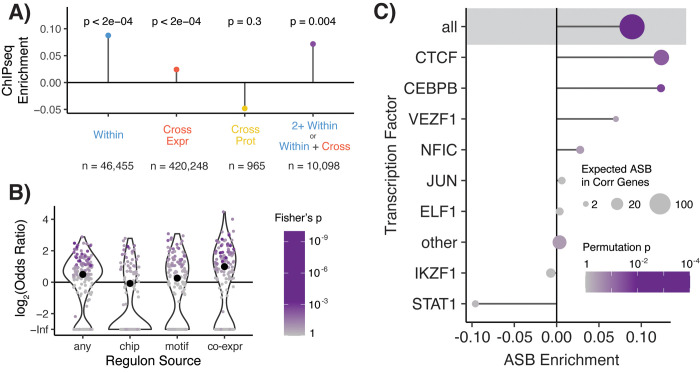
Fig 3. TF binding of TF-eQTL interactions.
A) Overlap enrichment of TFBS, based on TF ChIP-seq peaks, of TF-eQTL interactions by dataset. Permutation-based p-values are plotted above each measurement. Datasets include within-tissue (blue) interactions, cross-tissue expression-based (red), cross-tissue protein-based (yellow), and TF-eQTL interactions with at least two lines of evidence from cross-tissue expression-based and within-tissue interactions (purple). B) The enrichment of target genes with two lines of evidence for TF-eQTL interactions falling into that TF’s regulon. Large black dots depict overall enrichment across TFs. C) Enrichment for allele-specific TF binding (ASB) for TF-eQTL interactions with two lines of evidence. Shaded area contains statistics for unmatched TF ASB analysis. Below that, statistics for matched TF ASB analysis is shown, with TFs with more than one expected ASB event plotted individually, and all other TFs combined (other).

