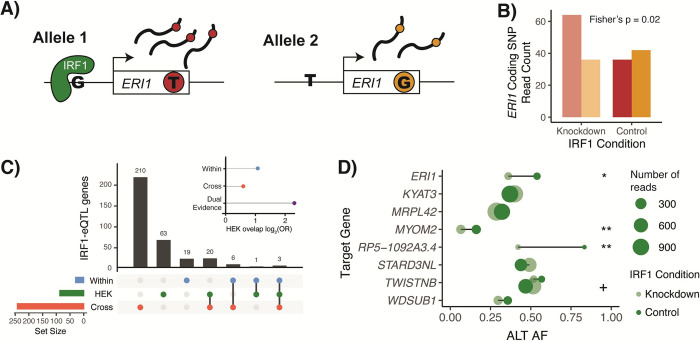
Fig 4. IRF1-eQTL interactions in HEK293-TLR4 IRF1 knockdown.
A) Depiction of allele-specific expression, with IRF1 preferentially binding to the G-allele in the regulatory region of the ERI1 target gene. This leads to higher expression of allele 1, which we can measure based on the presence of a heterozygous coding SNP in the ERI1 transcript. Reads from allele 1 will have a T genotype (red) at the coding SNP and reads from allele 2 will have a G (orange). B) Read counts for ERI1 coding SNP alleles in both knockdown and control conditions. In this example, it appears that we observe allelic effects at lower (knockdown) IRF1 levels, while higher (control) levels of IRF1 may saturate binding to both alleles. Conditions are compared using Fisher’s exact test of allelic counts. C) Sharing of IRF1-interacting eQTL genes in within-tissue (blue), cross-tissue expression-based (red), and HEK293T IRF1 knockdown (green) datasets. Only genes with an adequately expressed heterozygous coding SNP in HEK293T samples are included. Inset shows enrichment for overlap between HEK293T IRF1-eQTL genes and listed datasets. D) HEK293T coding SNP alternative allele frequency in dual-evidence IRF1-eQTL genes that were heterozygous for a top TF-eQTL variant and had adequate coverage of a heterozygous coding SNP. + indicates a Fisher’s p value < 0.1, * < 0.05, ** < 0.01 of allelic counts vs. condition.

