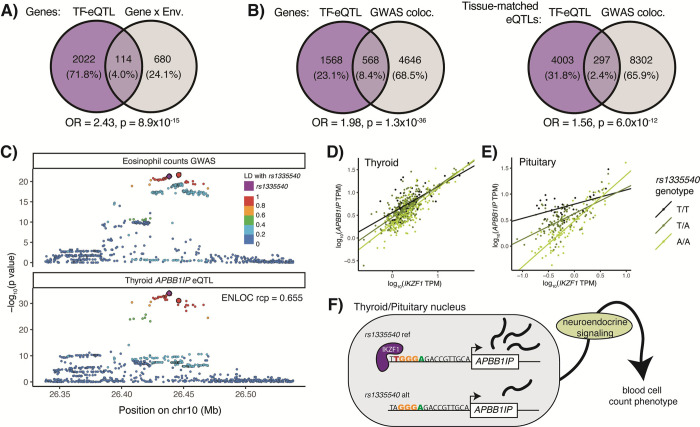
Fig 5. TF-eQTL implications for gene-by-environment and GWAS effects.
A) Overlap of TF-eQTL genes with GxE genes from Findley et al. 2021. B) Overlap of TF-eQTL genes with GWAS colocalizing eQTL genes from GTEx. The first diagram shows overlap for a gene with a TF-eQTL in any tissue and colocalizing eQTL in any tissue. The second shows overlap of tissue eQTLs with TF-eQTL and/or colocalizing GWAS locus in the given tissue. C) Representative eQTL and GWAS p-values are plotted for variants in the region of an APBB1IP eQTL and blood trait GWAS locus. Lead variants from IKZF1-eQTL interactions in thyroid, pituitary, and tibial artery are larger and outlined in black. (The lead variant from pituitary/artery cannot be seen as it falls behind rs1335540.) D) & E) Individual samples in thyroid and pituitary tissues are plotted by IKZF1 and APBB1IP expression, and linear regression lines are plotted by genotype. The difference in APBB1IP expression between the genotypes gets smaller as IKZF1 expression increases across the samples. F) Schematic of IKZF1 regulation of APBB1IP and blood cell counts. An IKZF1 binding site predicted by the HOCOMOCO IKZF1 motif lies nine bases upstream of APBB1IP’s transcription start site, which is disrupted by the alternative allele of rs1335540. Under our neuroendocrine signaling hypothesis, APBB1IP expression in neuroendocrine tissues goes on to alter system-wide neuroendocrine signaling, which would cause changes in blood cell counts. As IKZF1 appears to regulate the APBB1IP eQTLs in these tissues, it would follow that IKZF1 TF therefore may regulate the effect of this locus on blood cell counts.

