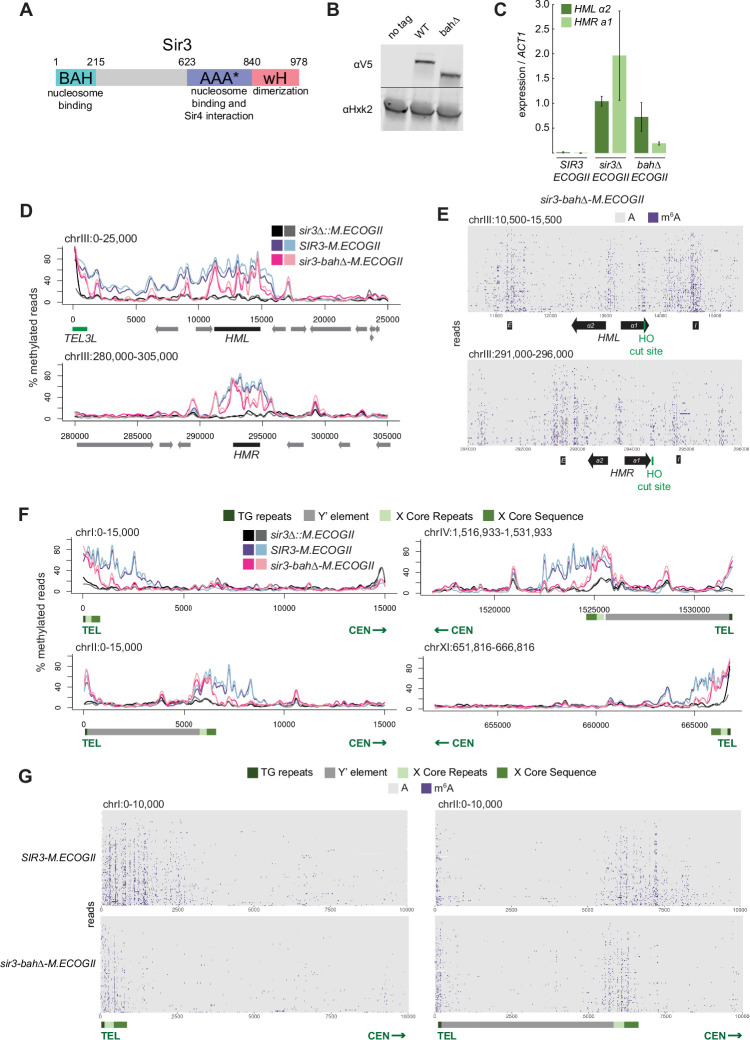
Figure 2. Nucleosome binding was required for spread, but not recruitment, of Sir3 to regions of heterochromatin.
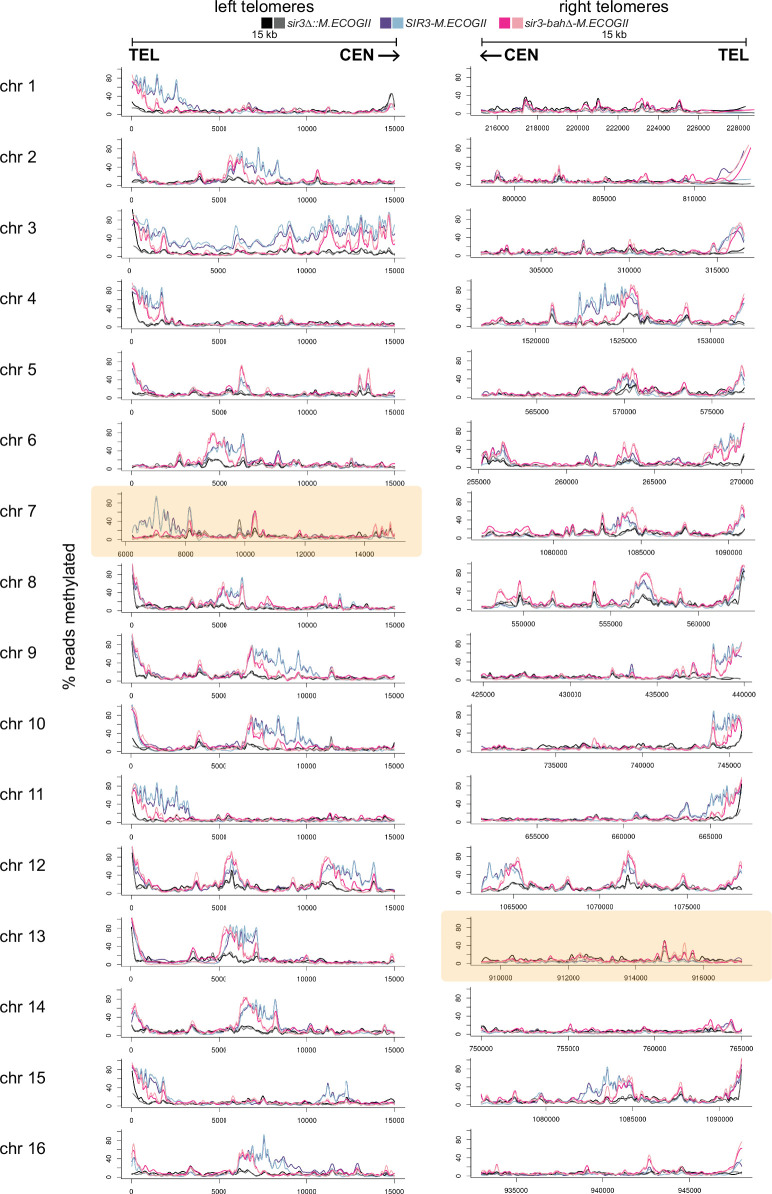
(A) Schematic of Sir3 protein domains. (B) Protein immunoblotting in strains expressing Sir3 (no tag, JRY11699), Sir3-3xV5 (JRY12601), and sir3-bah∆–3xV5 (JRY13621). Top row are 3xV5-tagged Sir3 proteins, and bottom row is the loading control Hxk2. The unedited blot is in Figure 2—source data 1. (C) RT-qPCR of HMLα2 and HMRa1 mRNA, normalized to ACT1 mRNA, in strains expressing SIR3-M.ECOGII (JRY12840, JRY13027), sir3∆::M.ECOGII (JRY13029, JRY13030), and sir3-bah∆-M.ECOGII (JRY13438, JRY13439). Data are the average of three biological replicates, and bars mark one standard deviation. (D) Aggregate methylation results at HML (top) and HMR (bottom) from long-read Nanopore sequencing of sir3∆::M.ECOGII (JRY13029, JRY13030), SIR3-M.ECOGII (JRY12840, JRY13027), and sir3-bah∆-M.ECOGII (JRY13438). Plots are as described in Figure 1D. (E) Single-read plots from long-read Nanopore sequencing of sir3-bah∆-M.ECOGII (JRY13438) at HML (top) and HMR (bottom). Plots are as described in Figure 1E. (F) Aggregate methylation results at four representative telomeres (1 L, 2 L, 4 R, and 11 R) from long-read Nanopore sequencing of the same strains as D. Shown are 15 kb windows of each telomere. Plots are as described in Figure 1D. (G) Single-read plots from long-read Nanopore sequencing of SIR3-M.ECOGII (JRY13027) and sir3-bah∆-M.ECOGII (JRY13438) at two representative telomeres (1 L and 2 L). Shown are 10 kb windows of each telomere.
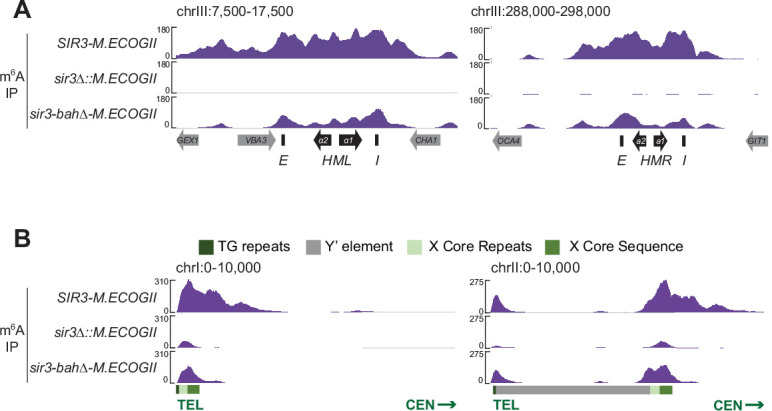
Figure 2—figure supplement 1. DIP-seq of SIR3-M.ECOGII (top row, JRY13027), sir3∆::M.ECOGII (middle row, JRY13030), and sir3-bah∆-M.ECOGII (bottom row, JRY13438).


