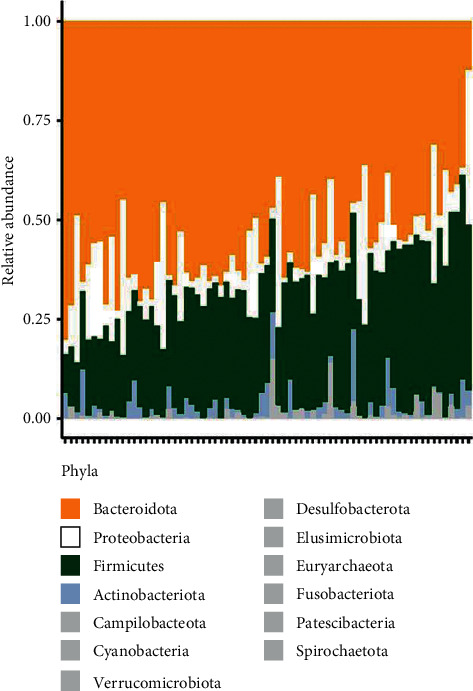
Figure 5.

Gut microbiome composition among individuals. Relative abundances of each phylum across every individual represented by stacked bars. Four most significant phyla are shown in individual colors. All other phyla are grouped as “Other,” and their combined relative abundances are represented in grey. The relative abundance of Firmicutes ranged from ∼2% to 40%, while abundance of Bacteroidetes ranged from ∼75% to ∼25%.
