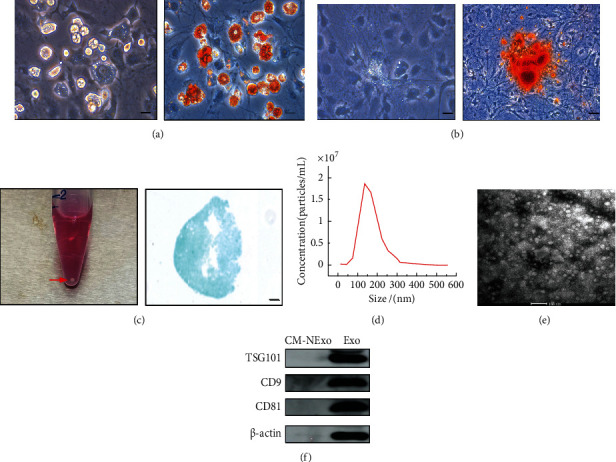
Figure 2.

Characterization of ADSCs and ADSC-Exos. (a) Adipogenic differentiation of ADSCs was confirmed by Oil Red O staining. Scale bar = 100 μm. (b) Osteogenic differentiation of ADSCs was confirmed by Alizarin Red S staining. Scale bar = 50 μm. (c) Chondrogenic differentiation of ADSCs was confirmed by Alcian Blue staining. The red arrow indicates the micromass of ADSCs. Scale bar = 100 μm. (d) Nanoparticle size distribution of ADSC-Exos was analyzed by NTA. (e) The morphology of ADSC-Exos was observed by TEM. Scale bar = 100 nm. (f) Western blotting was used to identify exosome-specific markers (TSG101, CD9, and CD81). CM-NExo: exosome-depleted culture medium; Exo: ADSC-Exos.
