
Figure 3.
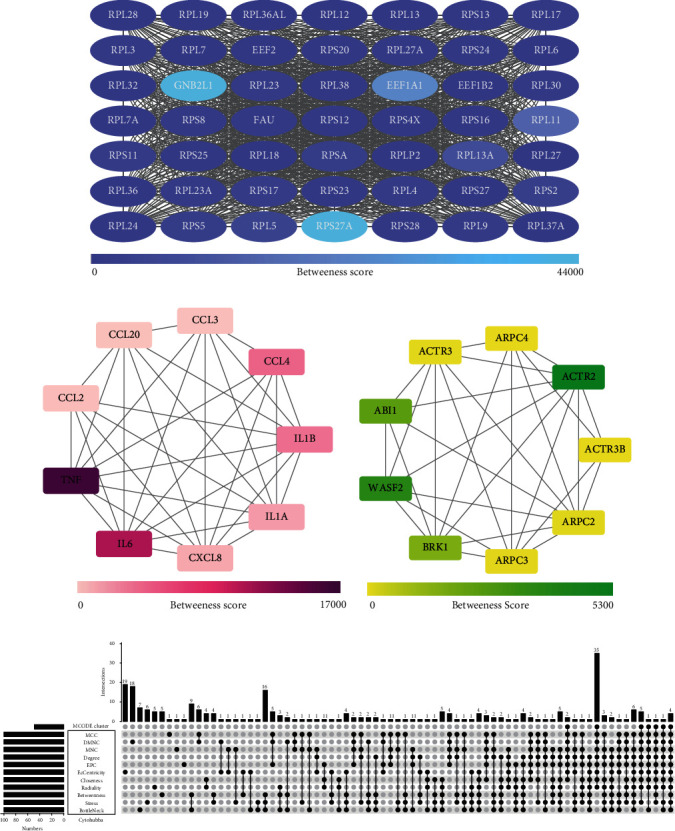
(a–c) Key gene modules predicted by MCODE. The top 3 key gene clusters calculated by the MCODE algorithm plug-in are uncovered, and their scores in the plug-in are 48.208, 8.250, and 7.250, respectively. The color in the figure from light to dark displayed how much the Betweenness Centrality score of each gene is. (d) The UpsetR plot unfurled the details of the number of overlapping genes obtained by the MCODE algorithm plug-in and the CytoHubba algorithm plug-in which 11 algorithms are employed.