Figure 5.
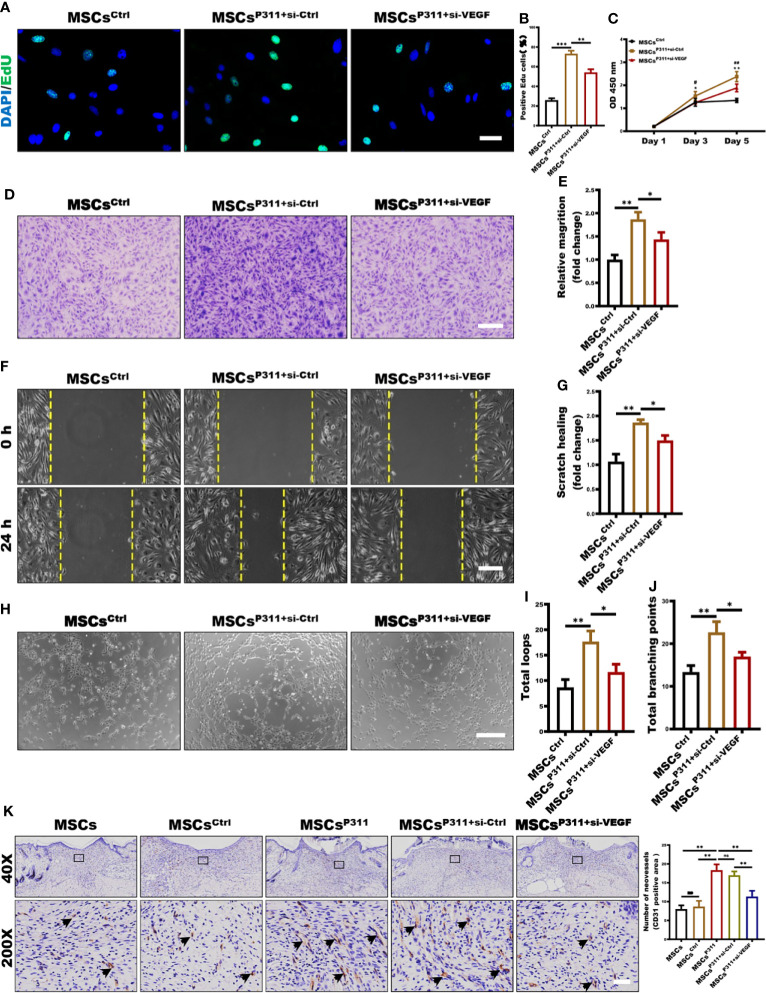
VEGF is essential in P311-mediated angiogenesis of MSCs in vitro and in vivo. The roles of VEGF in P311-mediated promotion of MSCs on ECs proliferation and motility were estimated by using MSCsP311 transfected with VEGF si-RNA (MSCsP311+si-VEGF) or control vehicle (MSCsP311+si-Ctrl). (A–E) Using transwell system mentioned above, ECs were co-cultured with MSCsP311+si-VEGF or MSCsP311+si-Ctrl for 24 hours at ratio 4:1. (A, B) The proliferation of ECs was examined at single cell level by EdU assays at 24 hours after co-incubation. Representative confocal images of EdU were shown (left panel), and the number of EdU-positive cells was counted and statistically analysed (right panel). Scale bar: 100 µm. (C) Cell viability for ECs was detected by means of CCK8 assay on day 1, 3 and 5 after co-incubation. (* means MSCsCtrl vs MSCsP311+si-Ctrl, # means MSCsP311+si-Ctrl vs MSCsP311+si-VEGF) (D–G) The roles of VEGF in P311-mediated increase in motility of ECs was estimated by detecting the invasion and migration in MSCsP311+si-VEGF or MSCsP311+si-Ctrl co-incubation. (D, E) ECs in upper chamber were co-cultured with MSCsCtrl, MSCsP311+si-VEGF or MSCsP311+si-Ctrl in lower chamber at ratio 4:1 for 6 hours, and ECs that have migrated through the membrane were stained, counted, and statistically analysed. Scale bar: 200 µm. (F, G) The migration of ECs at 24 hours after co-incubation was detected by scratch assays with transwell co-culture system (0.4-µm pore size). Scale bar: 200 µm. (H–J) The regulation of P311 on pro-angiogenesis functions of MSCs was evaluated by tube-like structure formation assays in vitro. Representative images of tube-like structure formation were shown (left panel) and the number of loops and branch points were counted and statistically analysed (right panel). Scale bar: 200 µm. MSCsCtrl group: MSCsCtrl + ECs; MSCsP311+si-Ctrl group: MSCsP311+si-Ctrl + ECs. MSCsP311+si-VEGF group: MSCsP311+si-VEGF + ECs. (K) The representative immunohistochemical staining images of CD31-positive ECs were shown (black arrows, left panel), and the number of vessels was counted and statistically analysed (right panel). Scale bar: 50 µm. Data are representative of at least three independent experiments and represent mean ± SD of indicated number of mice per group. (ns, no statistical significance; *P < 0.05; **p < 0.01; ***p < 0.001).

