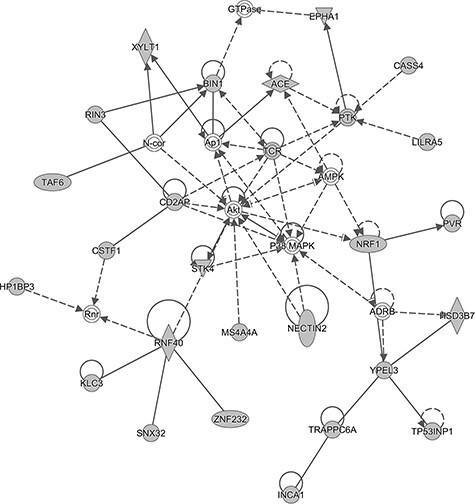
Figure 3.

The top molecular networks identified by Ingenuity Pathway Analysis (IPA). Molecule fill color: the white fill color shows molecules from the Knowledge Base—not part of our TWAS identified gene for ad risk; the gray fill color shows molecules of our TWAS identified genes for ad risk. Shape:  Other,
  Complex/Group/Other,
  Enzyme,
  Kinase,
  Peptidase,
  Transcription regulator. Relationship line:
  direct interaction,
  indirect interaction. More information of PIA legend can be found in: https://qiagen.secure.force.com/KnowledgeBase/?id=kA41i000000L5rTCAS.
