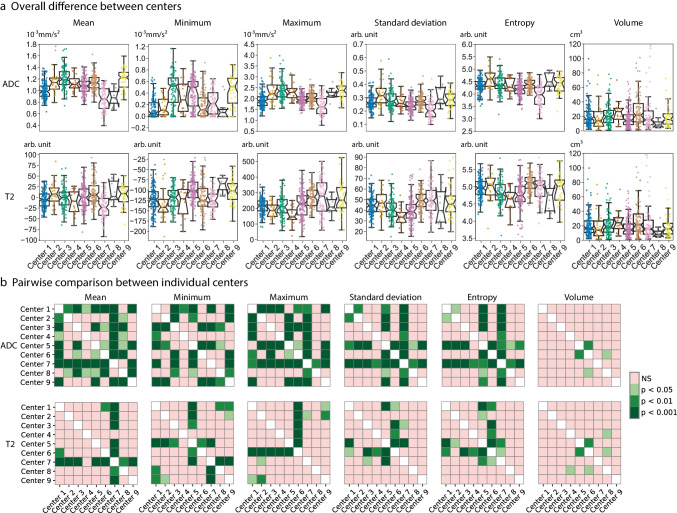
Fig. 3.
Center variations. a Visualization of the distribution of 6 basic (first-order + volume) imaging features within our study cohort, grouped by center. The imaging features were extracted from the rectal tumors on the ADC map (upper row) and T2W-MRI (bottom row), respectively. The boxplots show the distribution of the feature values for all patients within each center, with the notches in each box plot representing the 95% confidence intervals of the median feature value within a center. Kruskal–Wallis tests showed that for all features these median values were significantly different between the centers (p < 0.001). b Additional post hoc pairwise significance tests to explore which specific centers had significantly different feature values, with pink indicating no significant differences between centers and green indicating a significant difference (darker green corresponding to a higher level of significance). Bonferroni correction was used to account for multiple testing

