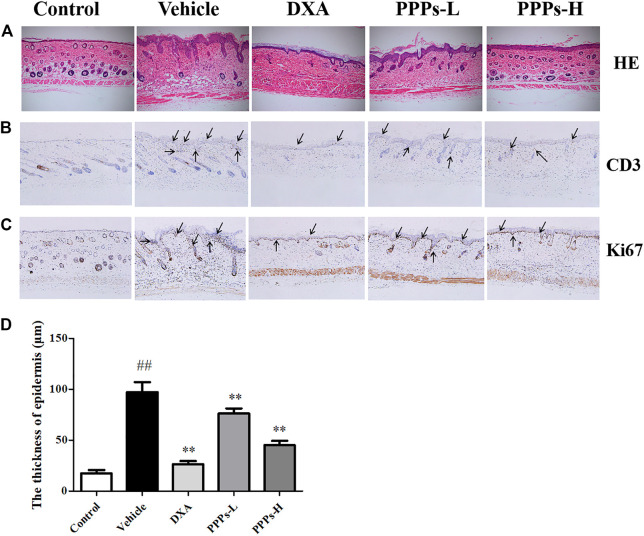
FIGURE 4.
Histological analysis and immunohistochemistry assay. Different treatments were administrated to mice. H&E staining (A) of the dorsal skin lesion in different groups. Immunohistochemical photographs of CD3 (B) and Ki67 (C) staining (magnification, ×100) of the dorsal skin in control or psoriatic mice post-treatment. The black arrows indicate the CD3 and Ki67 positive location. ##p < 0.01 compared with the control group; **p < 0.01 compared with the vehicle group. PPPs-L, low-dose PPPs; PPPs-H, high-dose PPPs.

