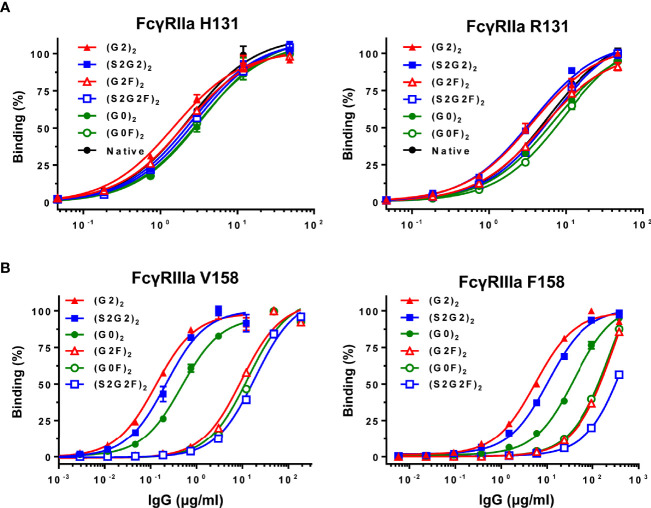
Figure 2.
Binding of IgG glycoforms to FcγRs. (A) FcγRIIa H131 and R131 variants. (B) FcγRIIIa V158 and F158 variants. All data points represent the calculated mean of two independent measurements from a total of at least two experiments. The data were fitted to a sigmoidal dose-response curve (GraphPad Prism).

