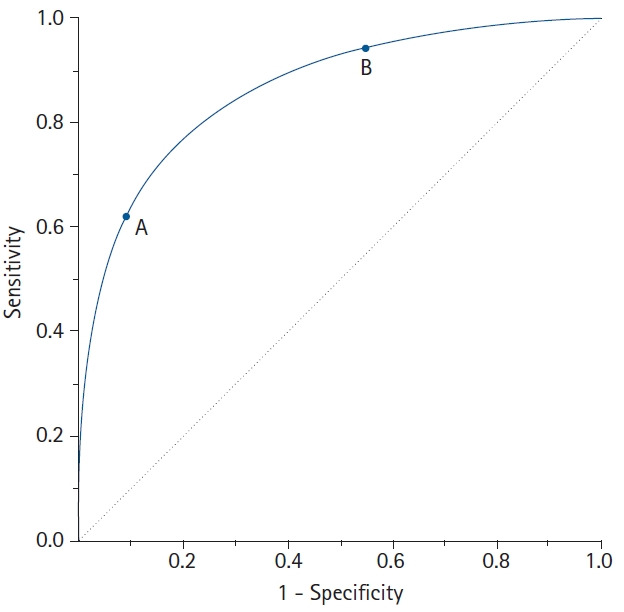
Fig. 2.

A receiver operating characteristic (ROC) curve connects coordinate points with 1 - specificity (= false positive rate) as the x-axis and sensitivity as the y-axis at all cut-off values measured from the test results. When a strict cut-off point (reference) value is applied, the point on the curve moves downward and to the left (Point A). When a loose cut-off point value is applied, the point moves upward and to the right (Point B). The 45° diagonal line serves as the reference line, since it is the ROC curve of random classification.
