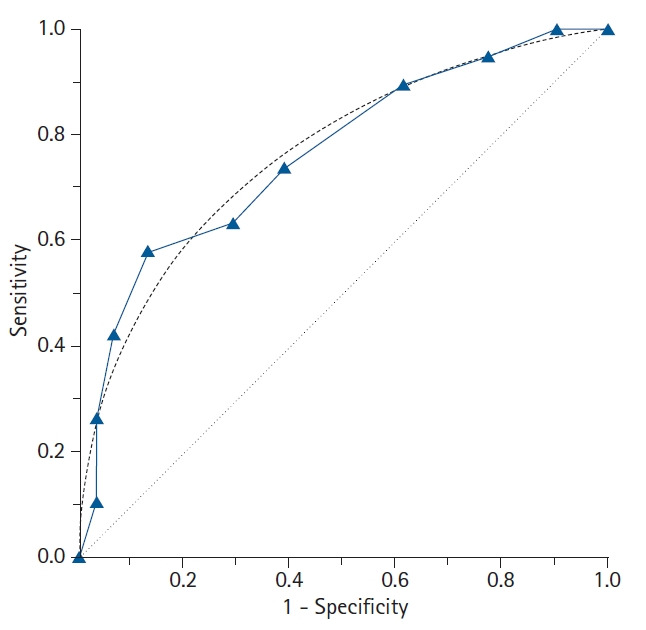
Fig. 3.

The features of the empirical (nonparametric) and binormal (parametric) receiver operating characteristic (ROC) curves. In contrast to the empirical ROC curve, the binormal ROC curve assumes the normal distribution of the data, resulting in a smooth curve. For estimating the binormal ROC curve, the sample mean and sample standard deviation are calculated from the disease-positive group and the disease-negative group. The 45° diagonal line serves as the reference line, since it is the ROC curve of random classification.
