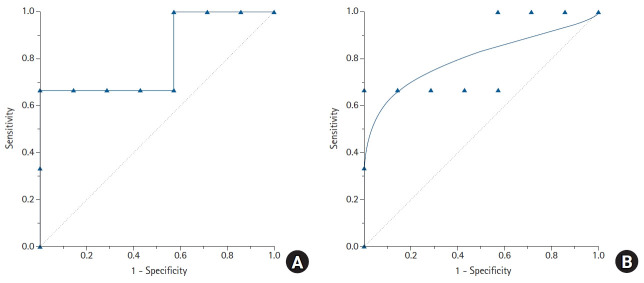
Fig. 5.
Empirical (A) and parametric (B) receiver operating characteristic (ROC) curves drawn from the data in Table 3. Eleven labeled points on the empirical ROC curve correspond to each cut-off value to estimate sensitivity and specificity. A gradual increase or decrease of the cut-off values will change the proportion of disease-positive patients. Depending on the cut-off values, each sensitivity and specificity pair can be obtained. Using these calculated sensitivity and specificity pairs, a ROC curve can be obtained with “1 – specificity” as the x coordinates and “sensitivity” as the y coordinates.

