
Figure 1. Chromatin regulator landscapes identify transcriptional dependencies in glioblastoma stem cells.
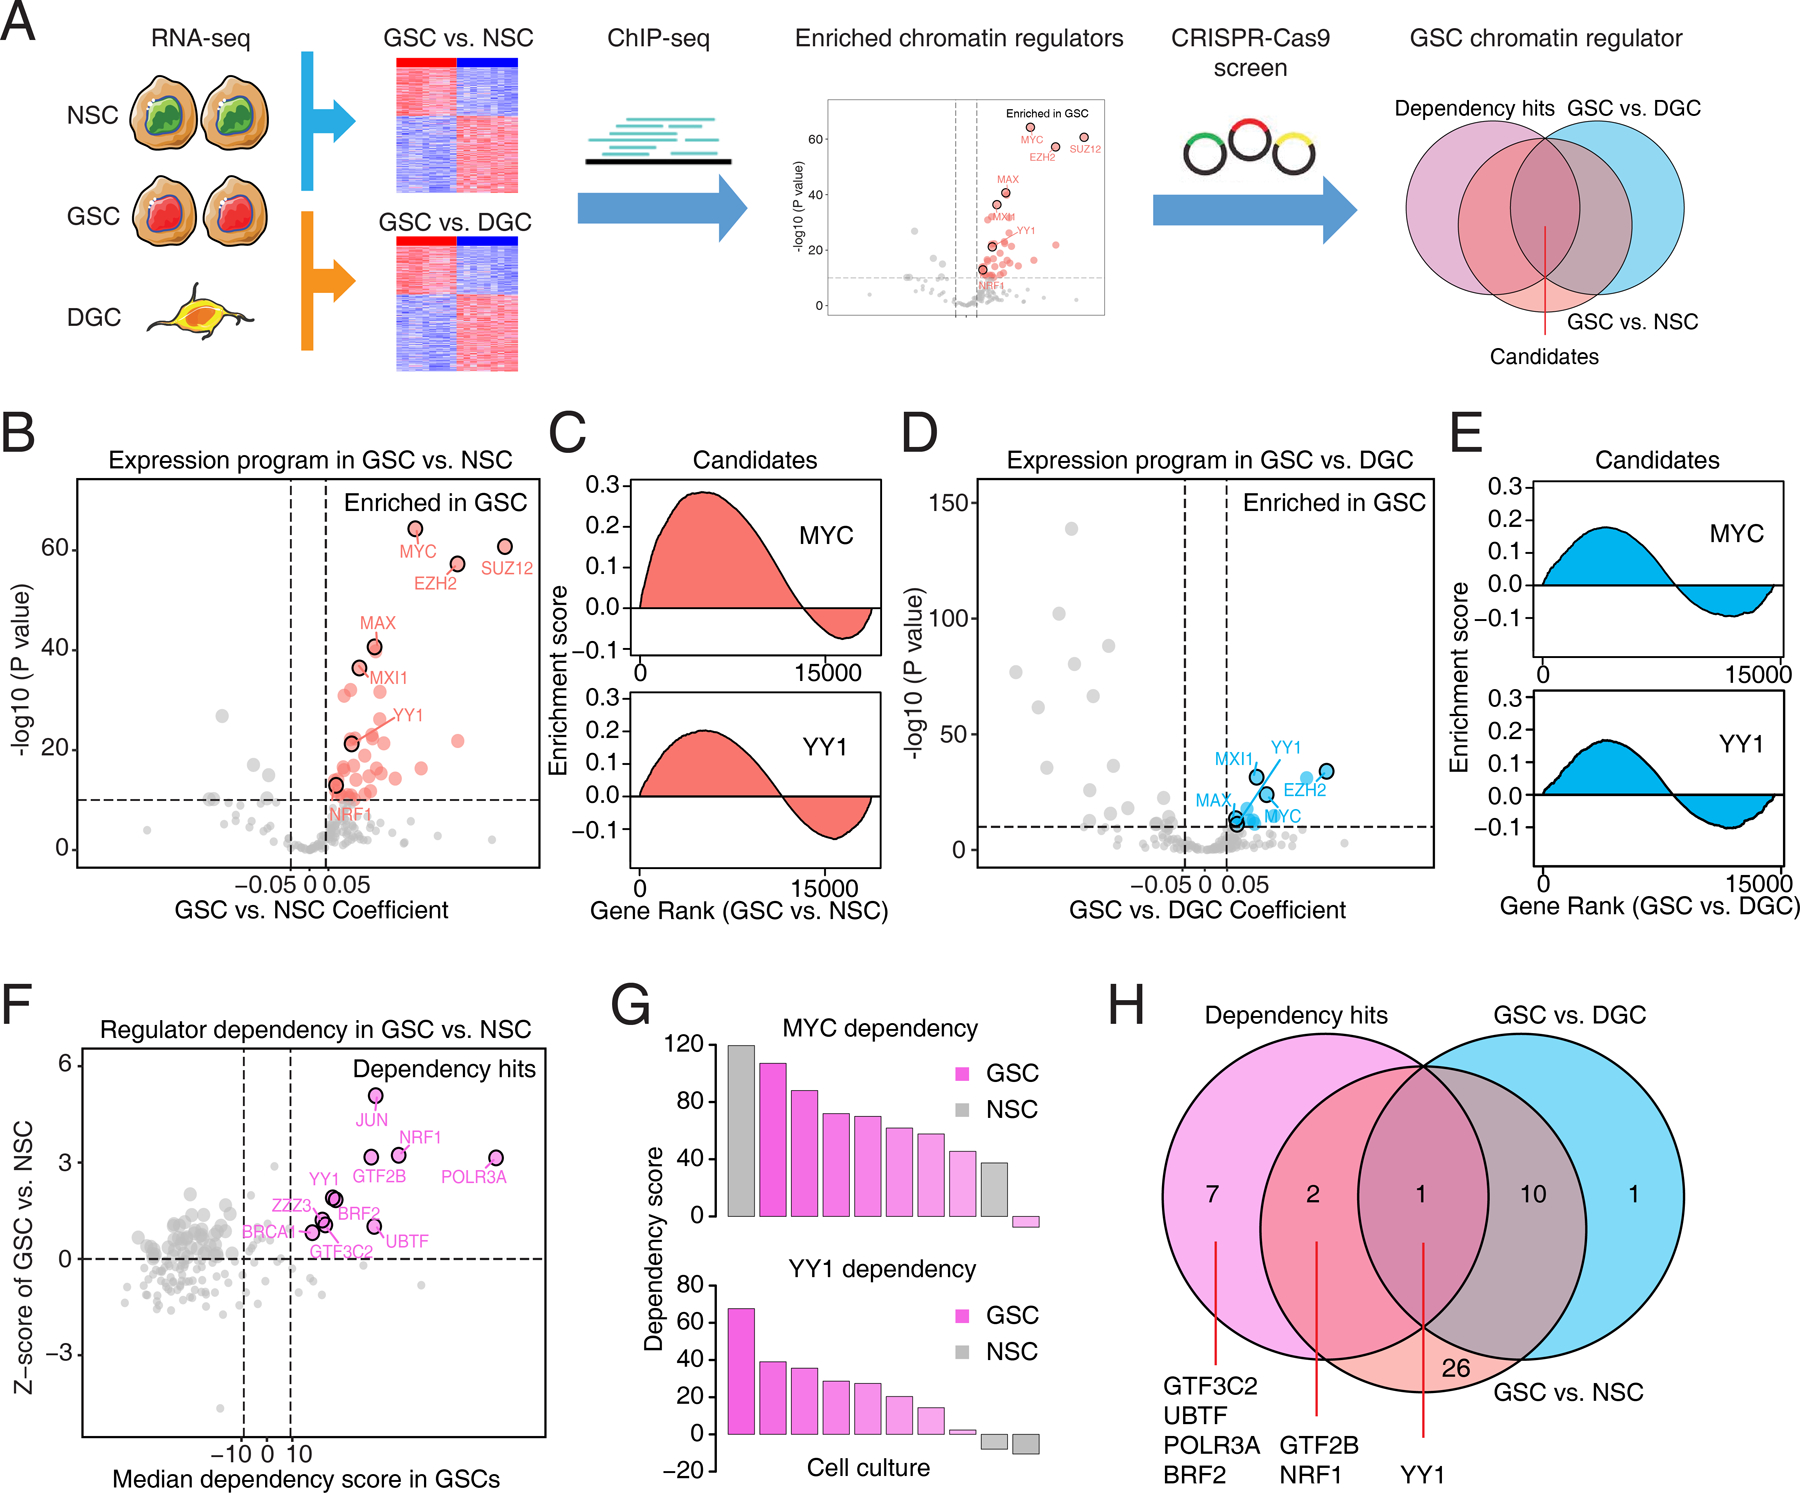
A, Diagram depicting the screening strategy to identify the enriched chromatin regulators with selective dependency in glioblastoma stem cells (GSCs). NSC, neural stem cell. DGC, differentiated glioblastoma cell. B, Volcano plot showing enrichment of 160 transcription regulator programs in 38 GSCs and 5 NSCs (GSE119834). Genes with its target program highly expressed in GSCs were labeled as red. C, Enrichment map visualization of candidate regulator programs (MYC and YY1) in GSCs compared to NSCs. D, Volcano plot showing enrichment of 160 transcription regulator programs in three pairs of GSCs and DGCs (GSE54791). Genes with its target program highly expressed in GSCs were labeled as blue. E, Enrichment map visualization of candidate regulator programs (MYC and YY1) in GSCs compared to DGCs. F, Scatter plot showing relative dependencies of 160 transcription regulators in 8 GSCs and 2 NSCs from whole genome CRISPR/Cas9 loss-of-function screening. Dependency genes specifically for GSCs were labeled as pink. G, Bar plots showing dependency scores of MYC and YY1 from whole genome CRISPR/Cas9 loss-of-function screening in a panel of GSCs (pink) and NSCs (gray). H, Venn diagram plot showing overlapping of transcription program and dependency hits for 160 regulators in GSCs.