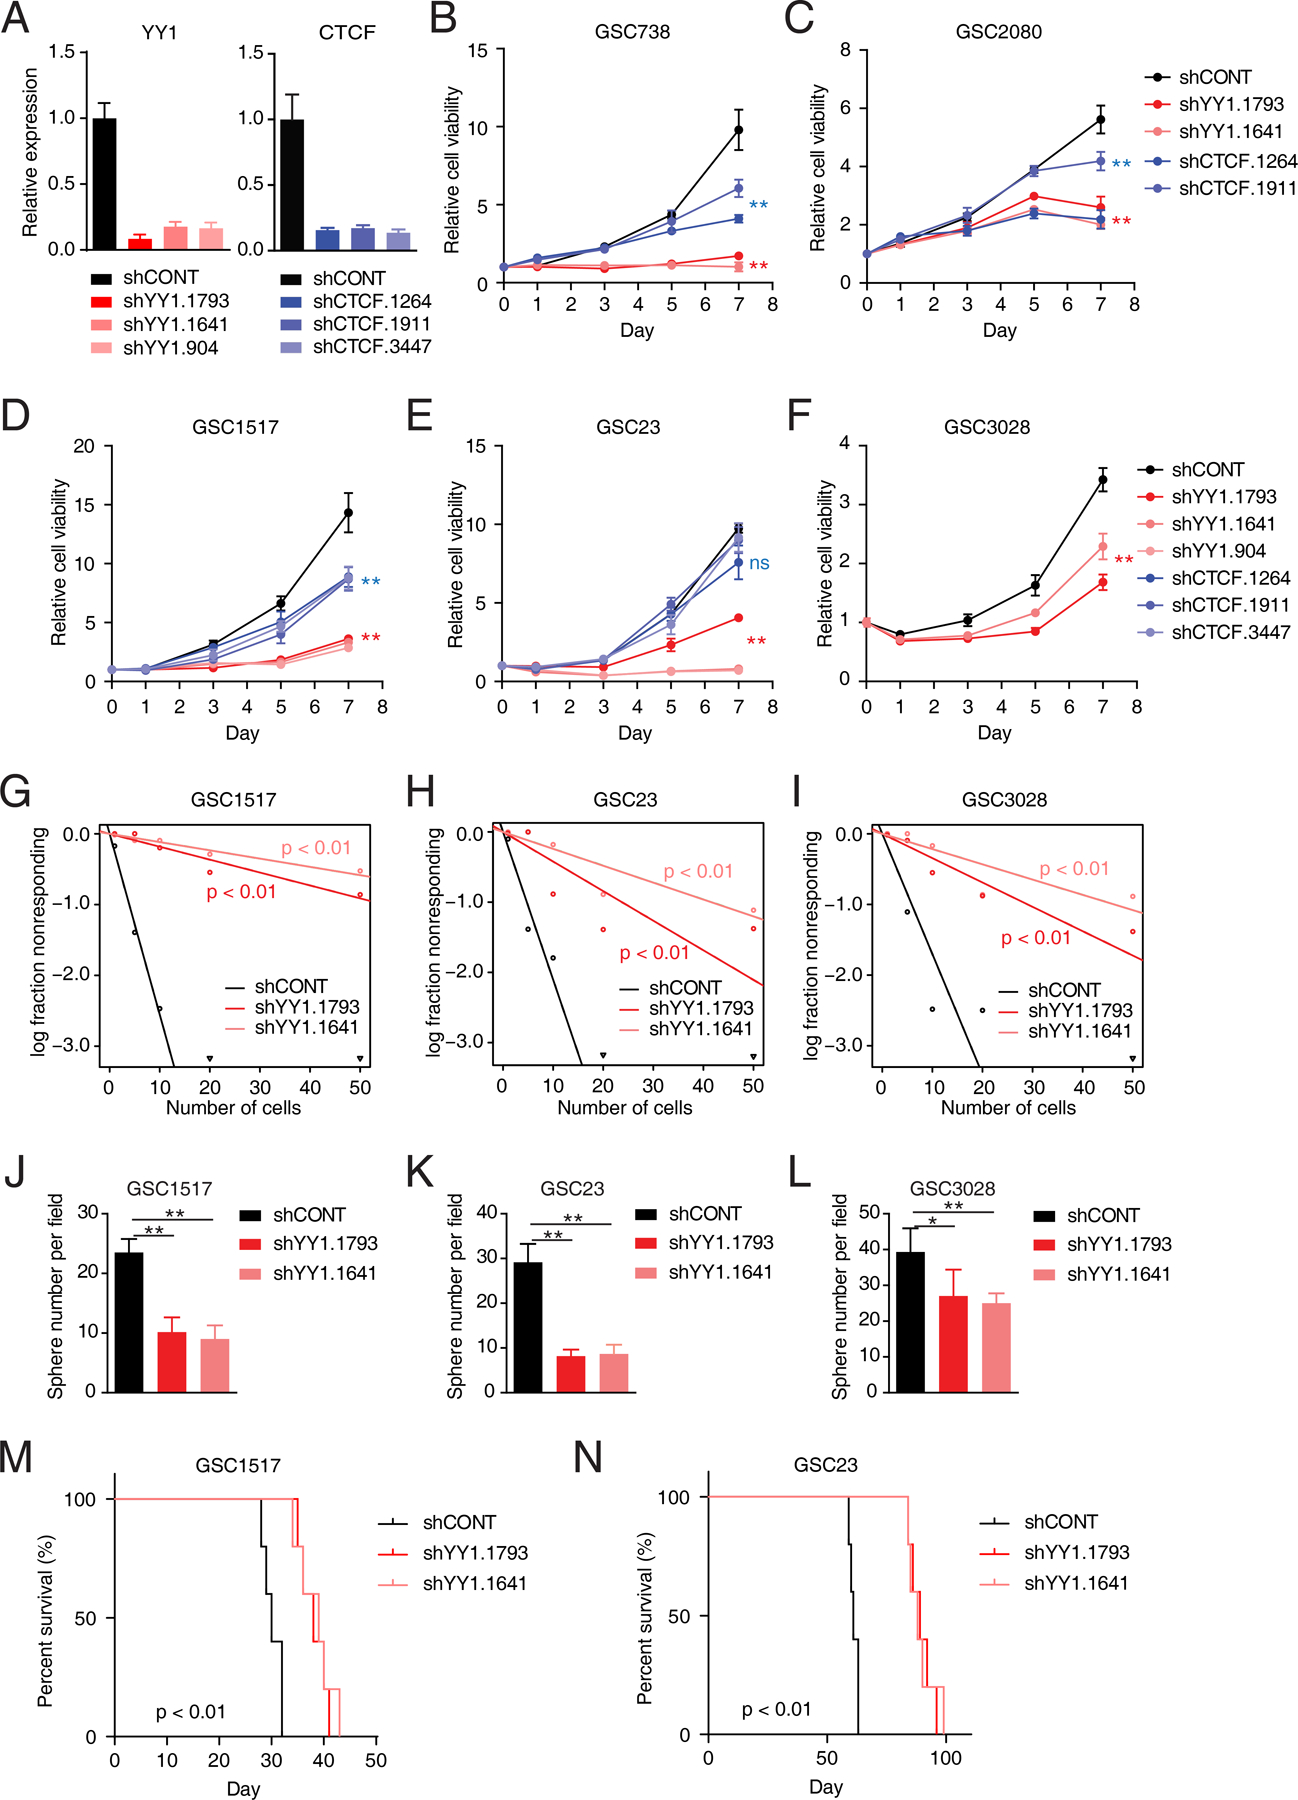
Figure 2. YY1 is essential for glioblastoma stem cells both in vitro and in vivo.

A, Bar plots showing YY1 and CTCF expression levels in GSC1517 with shRNA-mediated knockdown of YY1 or CTCF, respectively, as determined by qRT-PCR. Data are presented as mean + SD. B-F, Relative cell viabilities of a panel of GSCs with shRNA-mediated knockdown of YY1 or CTCF at different time points. Data are presented as mean ± SD. G-I, Tumor sphere formation efficiency and self-renewal capacity were measured by extreme in vitro limiting dilution assays (ELDA) in three GSCs. P-values were determined by likelihood ratio test. J-L, Bar plots showing the number of spheres from different GSCs after YY1 knockdown at day 7. Data are presented as mean + SD. M and N, Kaplan-Meier curves showing survival of immunocompromised mice bearing intracranial tumors from GSC1517 (M) and GSC23 (N) following transduction with indicated shRNAs. P-values were determined by log-rank test. *p < 0.05, **p < 0.01 by one-way ANOVA with Dunnett multiple comparison test; ns, not significant.
