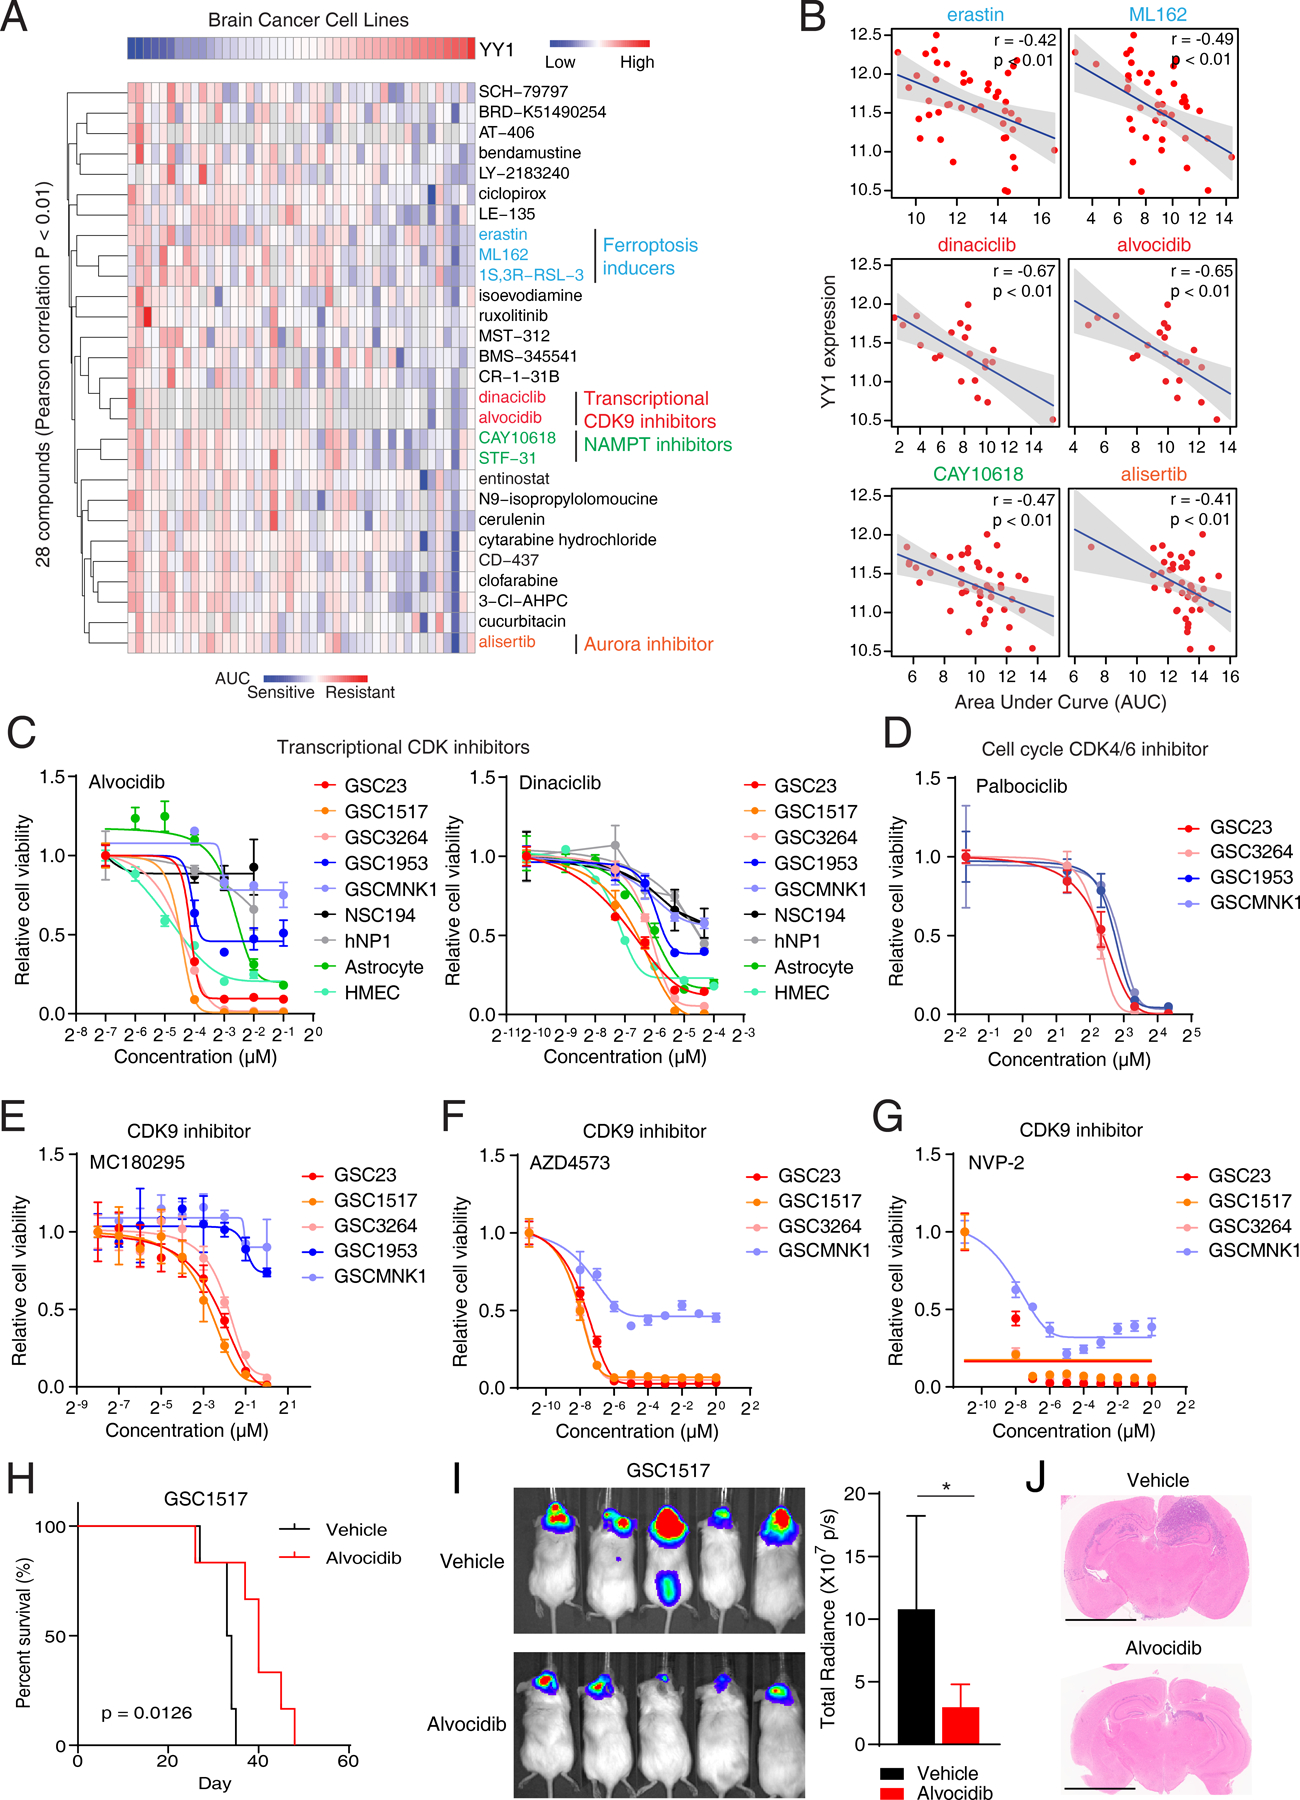
Figure 4. A pharmacogenomic analysis identifies YY1-associated therapeutic response in brain cancers.

A, Hierarchical clustering of drug AUC values from brain cancer cell lines. YY1 expression levels were shown on the top of the heatmap. Only drugs with Pearson correlation p-value < 0.01 were included. A low AUC value (blue) indicates sensitivity to drug treatment. B, Scatter plots showing correlation between YY1 expression levels and drug AUC values in brain cancer cell lines. Pearson correlation coefficients and p values were shown. C, Dose-response curves of transcriptional CDK inhibitors, alvocidib and dinaciclib, in YY1-dependent GSCs (GSC23, GSC1517 and GSC3264), YY1-independent GSCs (GSC1953 and MNK1) and non-malignant cells (astrocyte and HMEC). HMEC, Human Mammary Epithelial Cells. Data are presented as mean ± SD. D, Dose-response curves of cell cycle-related CDK4/6 inhibitor in 4 GSCs. Data are presented as mean ± SD. E-G, Dose-response curves of selective CDK9 inhibitors in GSCs. Data are presented as mean ± SD. H, Kaplan-Meier curves showing survival of immunocompromised mice bearing intracranial tumors from GSC1517 with vehicle or alvocidib (10 mg/kg) treatment. P-values were determined by log-rank test. I and J, In vivo bioluminescent imaging (I) and H&E-stained coronal sections (J) of immunocompromised mice bearing intracranial tumors with vehicle or alvocidib treatment. Scale bars, 2 mm. Data are presented as mean + SD. *p < 0.05 by unpaired Student’s t-test.
