
Figure 6. Targeting transcription elongation complexes elicits interferon response in glioblastoma stem cells.
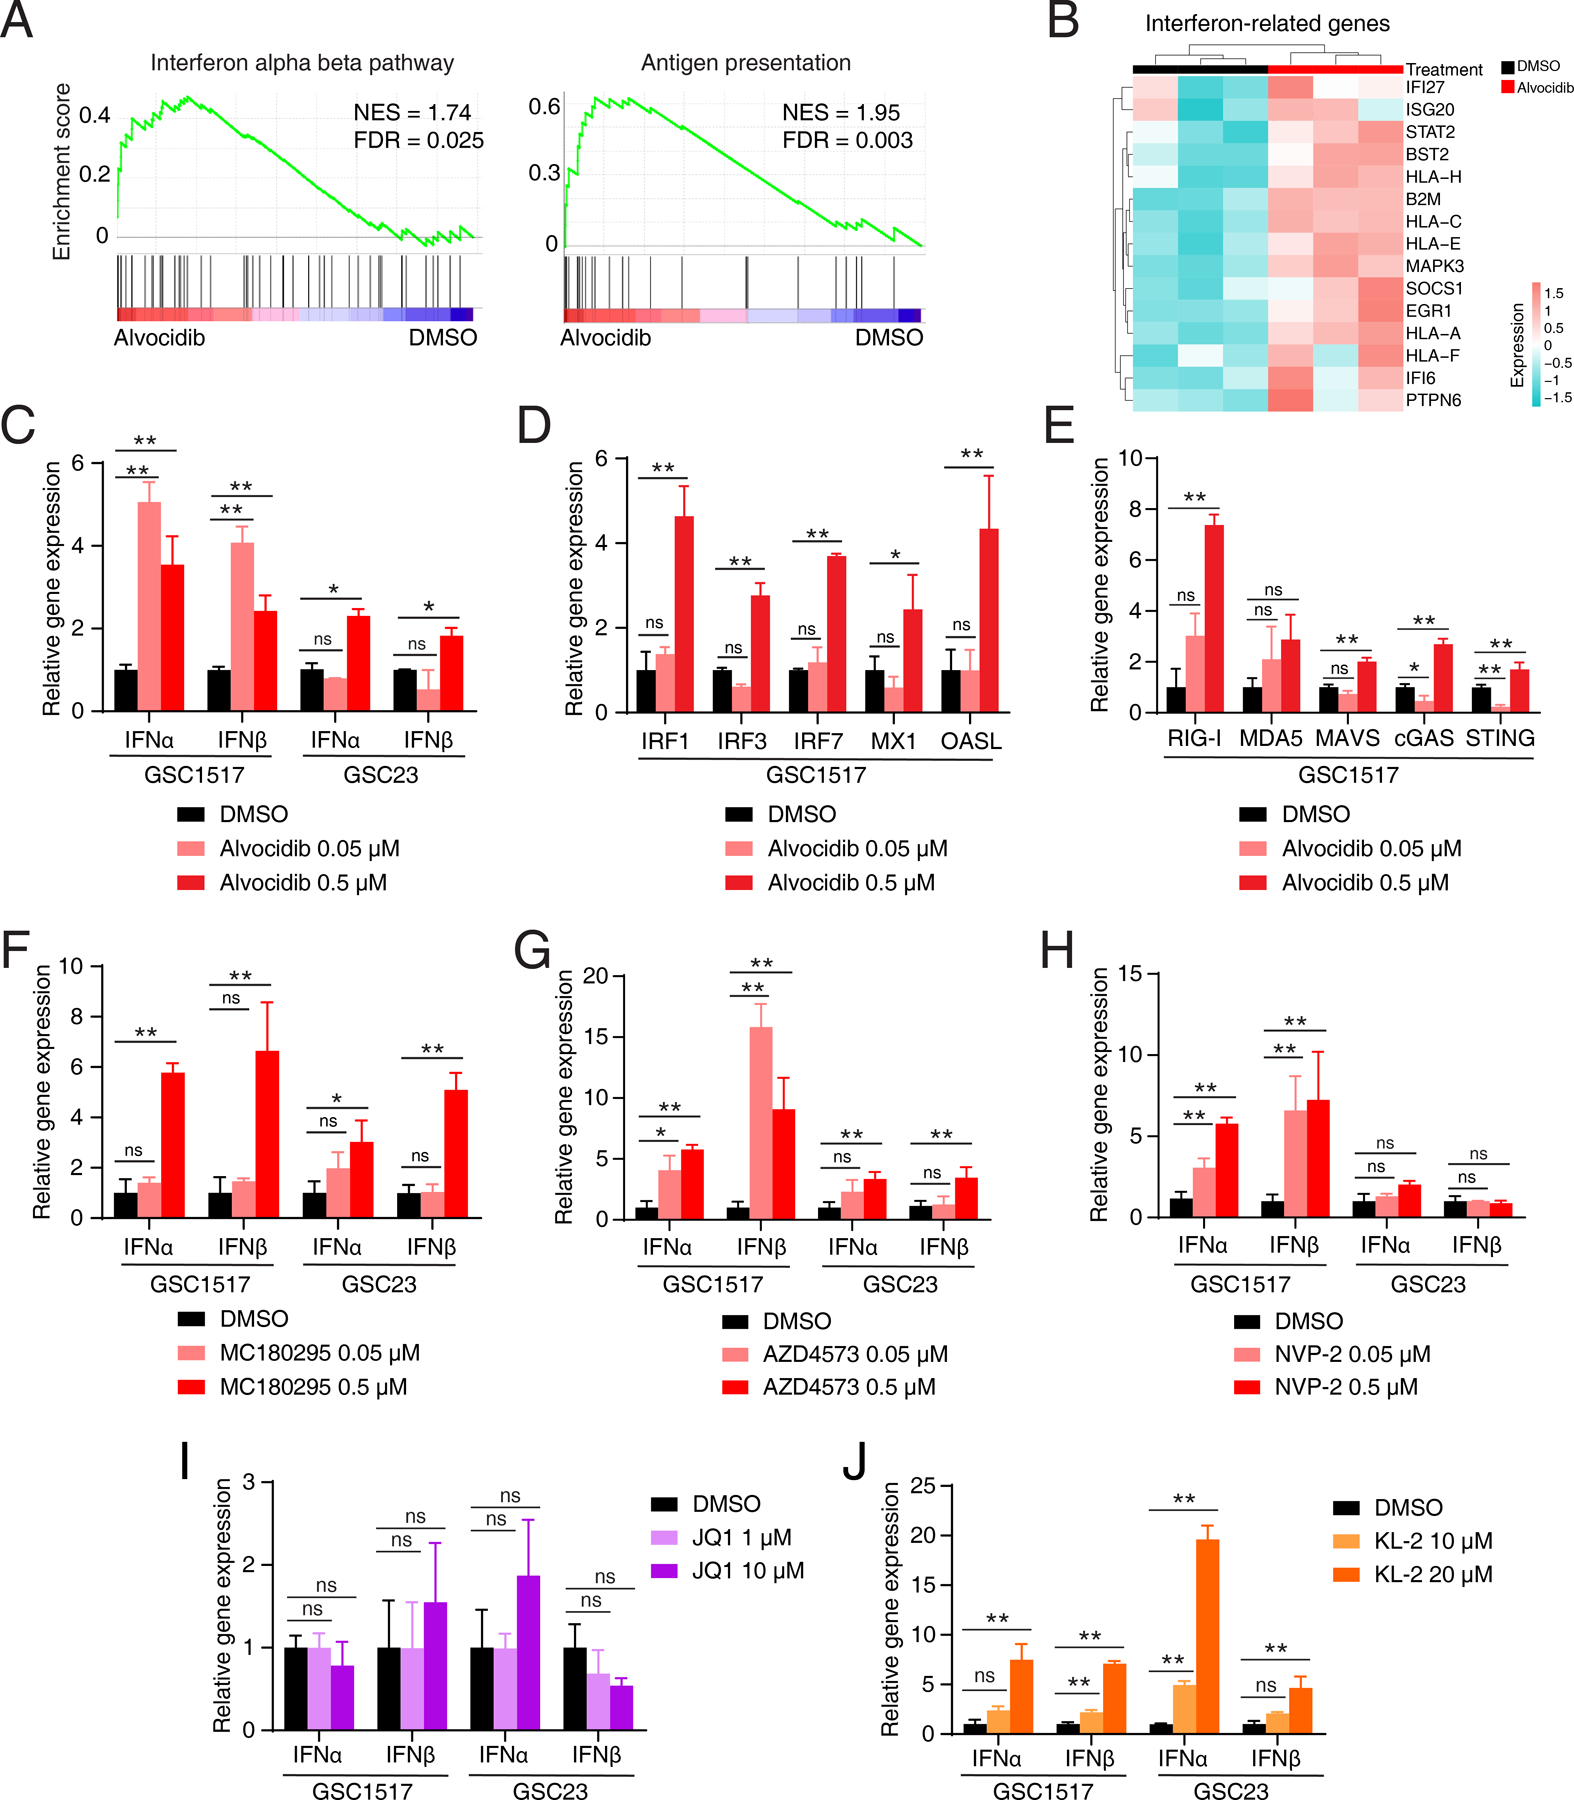
A, GSEA plots of representative gene sets involved in immune response after alvocidib treatment. The normalized enrichment score (NES) and false discovery rate (FDR) were indicated. B, Heatmap showing immune response related differentially expressed genes after alvocidib treatment in GSC1517 cells. C, Bar plots showing expression levels of IFNα and IFNβ in two GSC models (GSC1517 and GSC23) with alvocidib treatment determined by qRT-PCR. D and E, Bar plots showing expression levels of interferon-stimulated genes with alvocidib treatment in GSC1517 determined by qRT-PCR. F-H, Bar plots showing expression levels of IFNα and IFNβ in two GSC models (GSC1517 and GSC23) with selective CDK9 inhibitor treatment determined by qRT-PCR. I and J, Bar plots showing expression levels of IFNα and IFNβ in two GSCs (GSC1517 and GSC23) with BEC inhibitor JQ1 (I) and SEC inhibitor KL-2 (J) treatment determined by qRT-PCR. Data are presented as mean + SD. *p < 0.05, **p < 0.01 by one-way ANOVA with Dunnett multiple comparison test; ns, not significant.