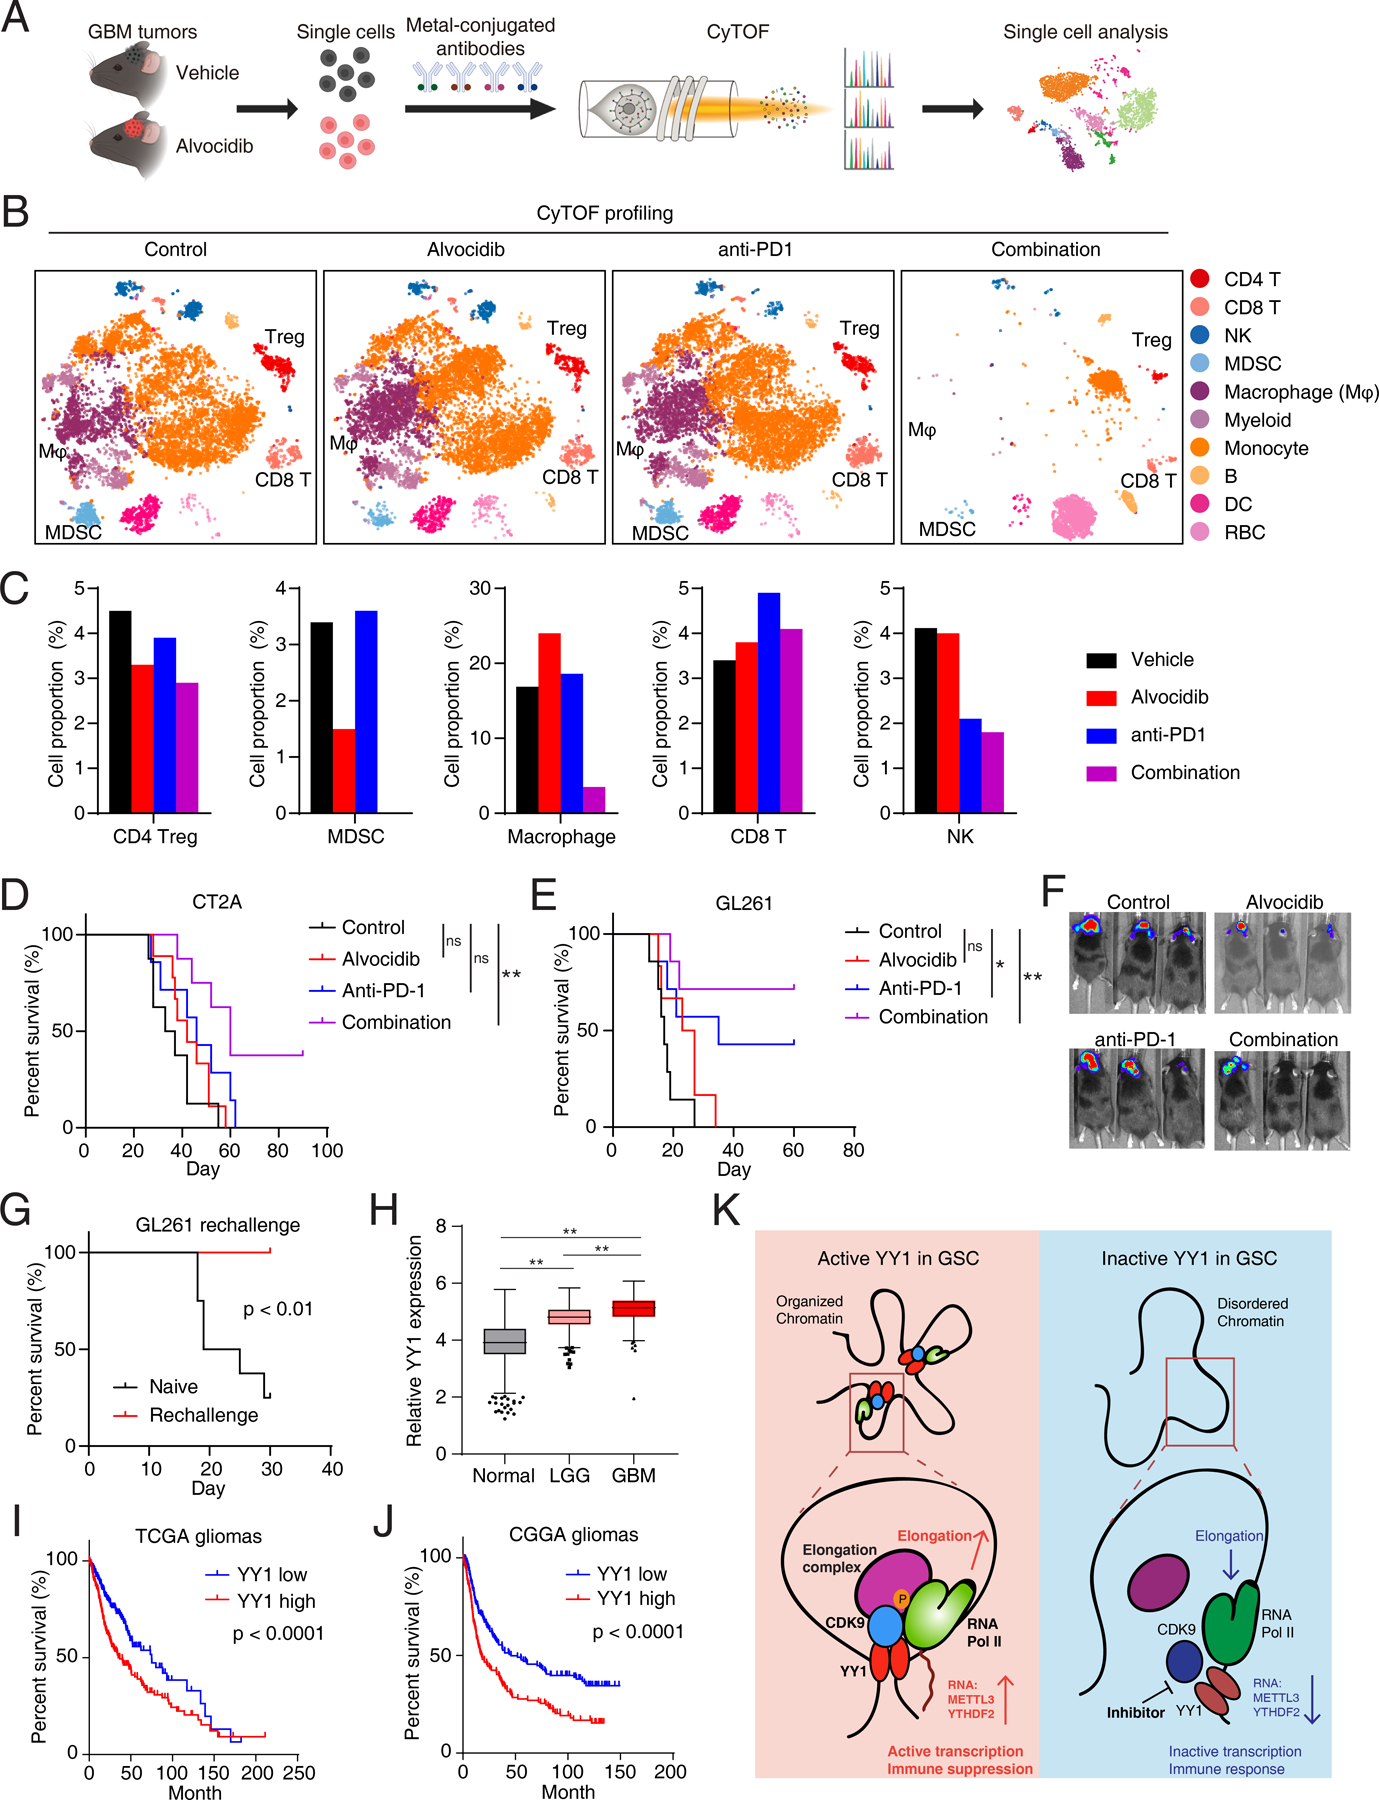
Figure 7. Pharmacological Targeting of the YY1-CDK9 complex reprograms microenvironment and enhances anti-PD-1 response in gliomas.

A, The workflow of the cytometry by time of flight (CyTOF) experiment to analyze the microenvironment in GBM models. B, The t-SNE plots of immune cell clusters from GL261 tumors treated with vehicle, alvocidib, anti-PD1 and combination, colored by cell clusters, from CyTOF analysis. C, Proportion of cells from GL261 tumors for the indicated cell types. D and E, Kaplan-Meier curves showing survival of immunocompetent mice bearing intracranial tumors from syngeneic CT2A (D) and GL261 (E) cells with alvocidib and anti-PD-1 treatment. *p < 0.05, **p < 0.01 by log-rank test; ns, not significant. F, In vivo bioluminescent imaging of immunocompetent mice bearing intracranial syngeneic tumors from mouse glioma CT2A cells with alvocidib and anti-PD-1 treatment. G, Kaplan-Meier curves showing survival of immunocompetent mice from Fig. 7D re-challenged with GL261 cells. P value was determined by log-rank test. H, Box-and-whisker plot showing expression pattern of YY1 in normal brains, low grade gliomas and glioblastomas from TCGA and GTEx databases. **p < 0.01 by one-way ANOVA with Dunnett multiple comparison test. I and J, Survival analysis of glioblastoma and low-grade gliomas in TCGA (I) and CGGA (J) databases divided by median value of YY1 expression levels. P value was determined by log-rank test. K, A working model showing the role of YY1-CDK9 complex in transcription elongation regulation and interferon response in GSCs.
