
Fig. 1 |. Unevenly segregated ecDNA drives intratumoral heterogeneity.
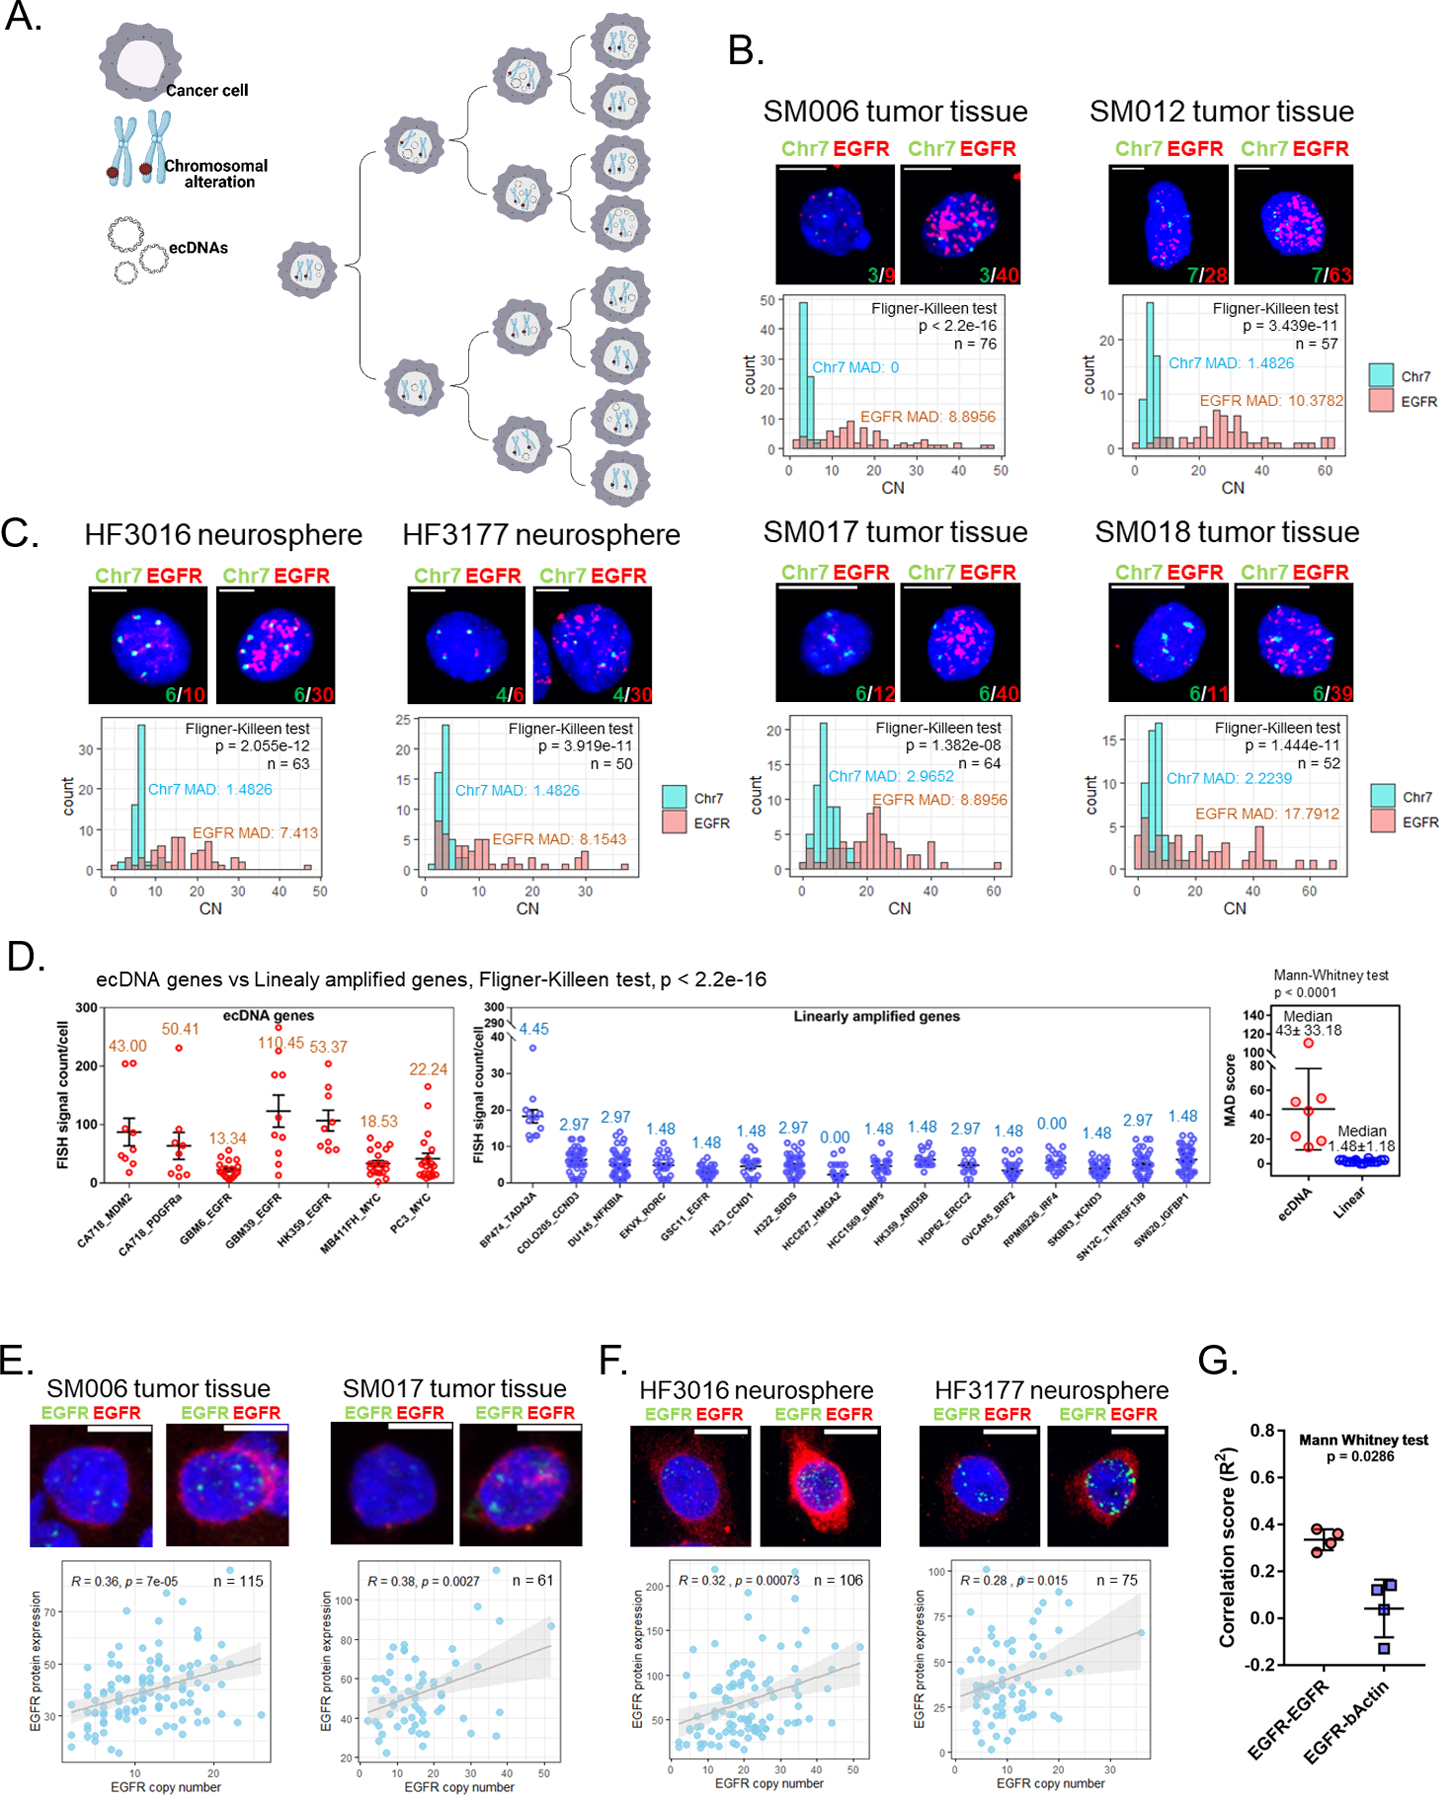
A. Cartoon representation of the pattern of inheritance of chromosomal alterations and ecDNAs. B-C. Representative EGFR/Chr7 FISH on four GBM tumor tissues (B, upper panel) and two neurosphere lines (C, upper panel). The MADs are indicated with the corresponding color in each image. Scale bar, 10 μm. Copy number count of each FISH probe per cell and p values indicating the homogeneity of variances between EGFR and Chr7 were determined by Fligner-Killeen test (lower panel). SM006 = Classical; SM012 = Proneural + Mesenchymal; SM017 = Mesenchymal + Classical; SM018 = Mesenchymal; HF3016 and HF3177 = Proneural. D. Copy number distribution of ecDNA genes (left panel) and linearly amplified genes (middle panel). The MADs indicated at the top of individual group. A p value indicating the homogeneity of variances between ecDNA genes and linearly amplified genes was determined by Fligner-Killeen test. The error bars represent standard error. The median MAD of ecDNA genes was significantly higher than the median MAD of linearly amplified genes. A p value indicating significant differences between two group was determined using a Mann-Whitney U test. The error bars represent standard deviation. E-F. ImmunoFISH experiment on two GBM tumor tissues (E) and two neurosphere lines (F). Scale bar, 10 μm. Green signal indicates EGFR FISH signal. Red signal indicates EGFR protein signal. Correlation between copy number of EGFR (number of EGFR DNA FISH signal foci) and EGFR protein expression (quantified based on signal intensity) per cell and p values were determined by Pearson’s correlation test (lower panel). EGFR protein signals that appears to be derived from the nucleus is in fact cytoplasmic and on the cell surface, but appears nuclear as two-dimensional images were obtained from a three-dimensional cell image. G. Comparison of Pearson’s correlation scores between EGFR-EGFR and EGFR-β-Actin.