
Fig. 2 |. CRISPR-based labeling enables live-cell ecDNA tracking.
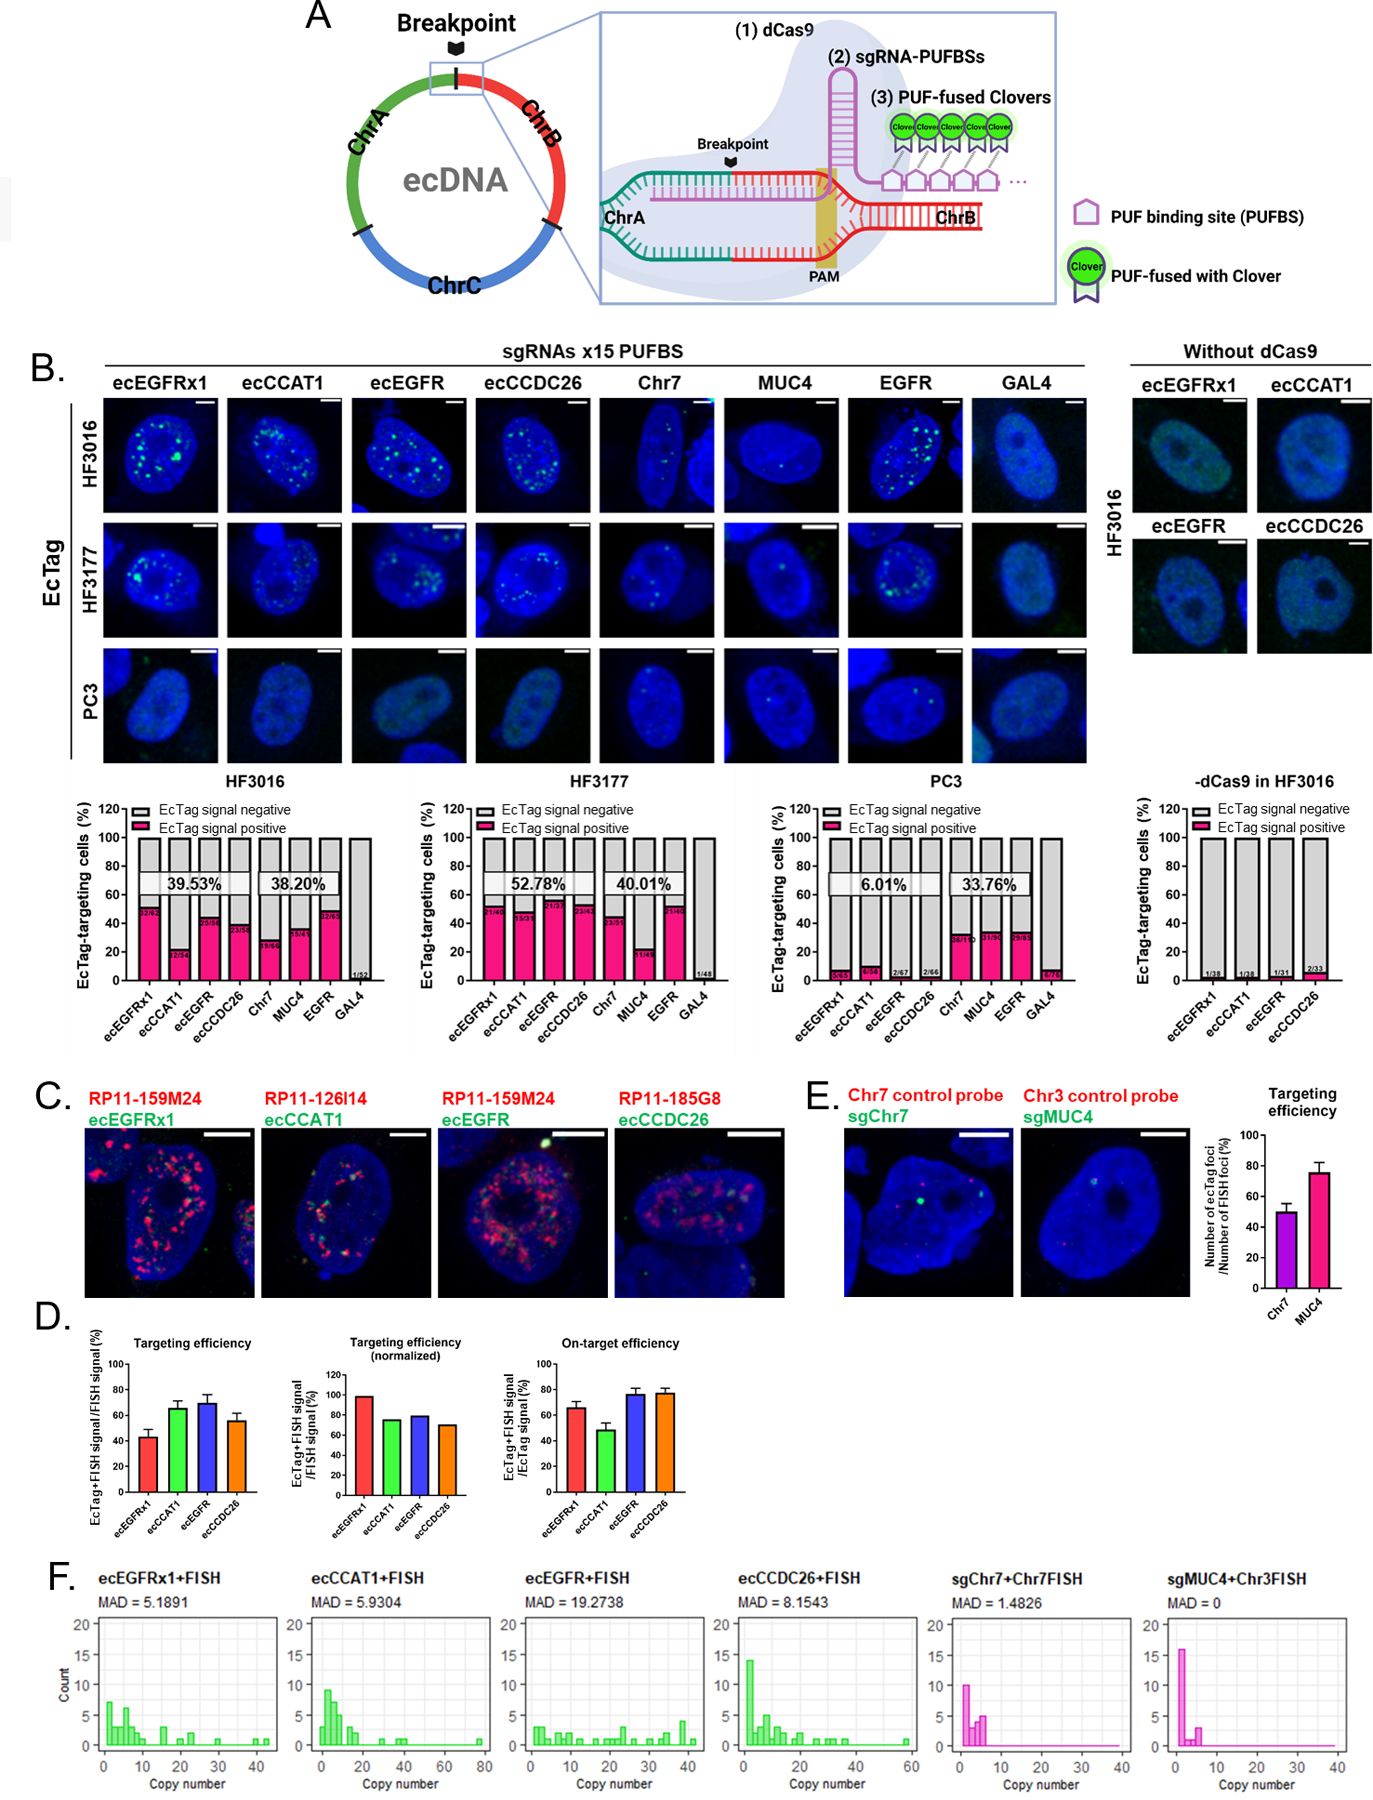
A. Schematic strategy of the ecTag ecDNA labeling system. B. Representative images of ecTag-transfected cells (upper panel). Scale bar, 10 μm. Proportion of ecTag-targeting cells out of the ecTag-transfected cells (bottom panel). The cells that have Clover signals spread out in the nucleus were counted as ecTag-transfected cells. Cells containing green spots in the nucleus were counted as ecTag-targeting cells. SgRNAs conjugated with 15 PUFBSs were used. (n = 31–110 cells per condition). C. Representative images of FISH validation (red BAC probe) performed on ecTag(green)-transfected HF3016 cells. Scale bar, 10 μm. SgRNAs conjugated with 25 PUFBSs were used. D. Proportion of ecTag and FISH double-positive signals relative to FISH (red) signals was calculated as targeting efficiency (left panel). The error bars represent S.E.M. Targeting efficiency normalized by the average proportion of Dual-FISH signals out of the red-color signals showed in Supplementary Figure 6D. Proportion of ecTag and FISH double-positive signals out of the ecTag (green) signals was calculated as on-target efficiency (right panel). n = 30–38 cells per condition. E. Representative images of FISH validation (red control chromosome probe) performed on control ecTag (Chr7 and MUC4, green)-transfected HF3016 cells. Scale bar, 10 μm. SgRNAs conjugated with 25 PUFBSs were used. Proportion of ecTag signals paired with FISH probe signals out of the FISH signals was calculated as targeting efficiency (right panel). The error bars represent S.E.M. n = 21–22 cells per condition. F. Copy-number distribution of ecTag/DNA FISH signals with a high MAD score in ecDNA-targeting group (green plots) confirmed that the ecTag system recapitulates the distribution pattern of ecDNA uneven segregation observed in oncogene-FISH and Dual-FISH. n = 21–38 cells per condition.