. 2021 Sep 21;12(2):484–501. doi: 10.1158/2159-8290.CD-21-0601

Figure 1.

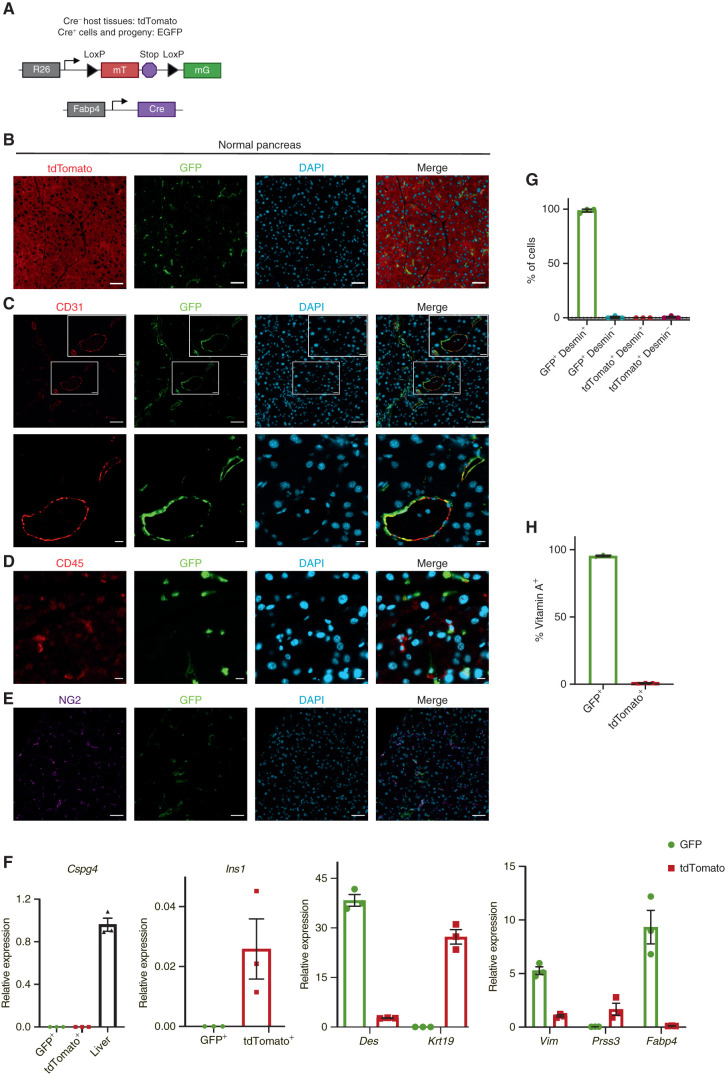
Figure 1. Fabp4-Cre marks stellate cells specifically and pervasively within normal pancreas tissue. A, Schematic of the alleles used to label and track PSCs in vivo. B, Representative image of normal pancreas tissue from Fabp4-Cre;Rosa26mTmG mice (n = 7) showing rare GFP+ cells within a predominantly tdTomato+ tissue. Scale bar, 50 μm. C, Representative image of normal pancreas tissue from Fabp4-Cre;Rosa26mTmG mice (n = 3) showing CD31+ endothelial cells and GFP+ cells, some of which are adjacent to vessels. Top images: scale bar, 50 μm; bottom images: scale bar, 10 μm. D, Representative image of normal pancreas tissue from Fabp4-Cre;Rosa26mTmG mice (n = 3) showing CD45+ leukocytes and GFP+ cells. Scale bar, 10 μm. E, Representative image of normal pancreas tissue from Fabp4-Cre;Rosa26mTmG mice (n = 3) showing NG2+ pericytes and GFP+ cells. Scale bar, 50 μm. F, qPCR for the indicated genes in GFP+ and tdTomato+ cells isolated from normal pancreas tissue from Fabp4-Cre;Rosa26mTmG mice by FACS (n = 3, with each replicate pooled from two mice), including markers of pericytes (Cspg4; liver is a positive control), stellate cells and potentially other mesenchymal cells (Des), ductal cells (Krt19), mesenchymal cells (Vim), acinar cells (Prss3), and β cells (Ins1); Fabp4 was included as a control. Data were normalized to 36b4 and are presented as mean ± SEM. G, Quantification of GFP+ cells and tdTomato+ cells out of total, desmin+ PSCs isolated by density centrifugation from normal pancreas tissue in Fabp4-Cre;Rosa26mTmG mice (n = 3) and analyzed by immunofluorescence microscopy. Data are presented as mean ± SEM. H, Flow cytometry results depicting GFP+ and tdTomato+ cells among all vitamin A+ PSCs in normal pancreas tissue from Fabp4-Cre;Rosa26mTmG mice (n = 3). Data are presented as mean ± SEM.

Fabp4-Cre marks stellate cells specifically and pervasively within normal pancreas tissue. A, Schematic of the alleles used to label and track PSCs in vivo. B, Representative image of normal pancreas tissue from Fabp4-Cre;Rosa26mTmG mice (n = 7) showing rare GFP+ cells within a predominantly tdTomato+ tissue. Scale bar, 50 μm. C, Representative image of normal pancreas tissue from Fabp4-Cre;Rosa26mTmG mice (n = 3) showing CD31+ endothelial cells and GFP+ cells, some of which are adjacent to vessels. Top images: scale bar, 50 μm; bottom images: scale bar, 10 μm. D, Representative image of normal pancreas tissue from Fabp4-Cre;Rosa26mTmG mice (n = 3) showing CD45+ leukocytes and GFP+ cells. Scale bar, 10 μm. E, Representative image of normal pancreas tissue from Fabp4-Cre;Rosa26mTmG mice (n = 3) showing NG2+ pericytes and GFP+ cells. Scale bar, 50 μm. F, qPCR for the indicated genes in GFP+ and tdTomato+ cells isolated from normal pancreas tissue from Fabp4-Cre;Rosa26mTmG mice by FACS (n = 3, with each replicate pooled from two mice), including markers of pericytes (Cspg4; liver is a positive control), stellate cells and potentially other mesenchymal cells (Des), ductal cells (Krt19), mesenchymal cells (Vim), acinar cells (Prss3), and β cells (Ins1); Fabp4 was included as a control. Data were normalized to 36b4 and are presented as mean ± SEM. G, Quantification of GFP+ cells and tdTomato+ cells out of total, desmin+ PSCs isolated by density centrifugation from normal pancreas tissue in Fabp4-Cre;Rosa26mTmG mice (n = 3) and analyzed by immunofluorescence microscopy. Data are presented as mean ± SEM. H, Flow cytometry results depicting GFP+ and tdTomato+ cells among all vitamin A+ PSCs in normal pancreas tissue from Fabp4-Cre;Rosa26mTmG mice (n = 3). Data are presented as mean ± SEM.