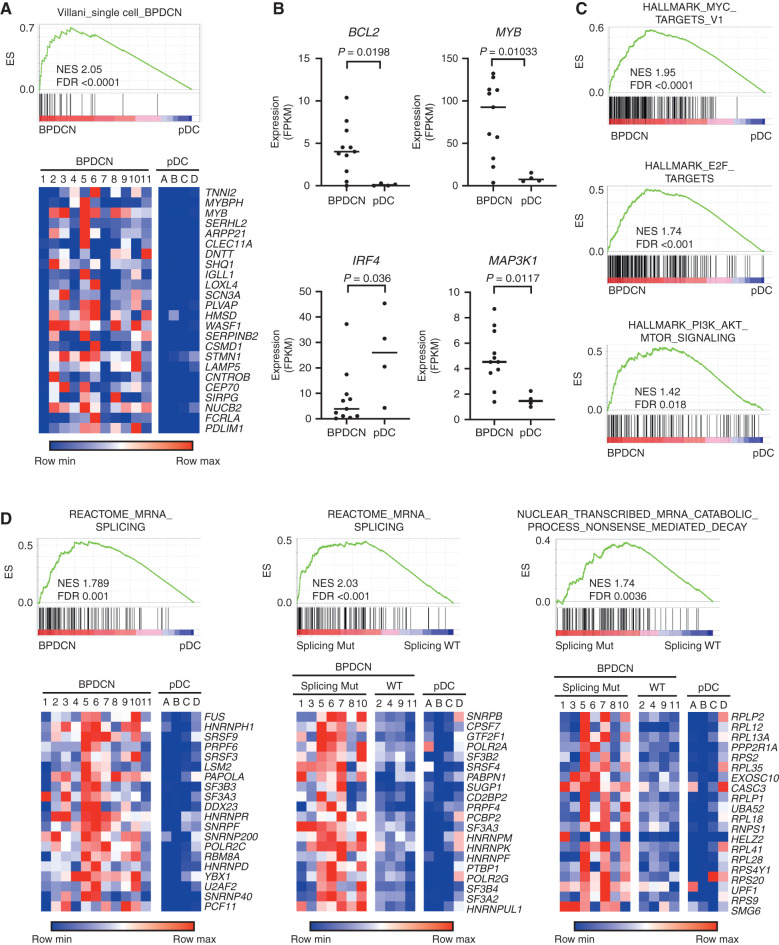
Figure 3.
BPDCN transcriptomes have alterations in oncogene, dendritic cell development, and RNA processing genes. A, GSEA showing association of a previously defined gene signature from single-cell RNA-seq that differentiated BPDCN from normal human dendritic cell subtypes (14) in BPDCN (n = 11) compared with normal pDCs (n = 4) from the current cohort. Heat maps of the same genes plotted as low (blue) to high (red) relative expression. B, RNA expression of the indicated genes in BPDCN (n = 11) compared with normal pDCs (n = 4), with groups compared by t test. FPKM, fragments per kilobase of transcript per million mapped reads. C, GSEA comparing BPDCN with normal pDCs showing enrichment of the indicated hallmarks of cancer gene sets (MSigDB collection “H”) in BPDCN. D, GSEA as in A for the indicated RNA splicing and nonsense-mediated decay gene sets with heat maps of the top 20 leading-edge genes plotted as low (blue) to red (high) relative expression. In the indicated plots, BPDCN are separated by whether (Splicing Mut) or not (Splicing WT) they harbor a mutation in a splicing factor (SF3B1, SRSF2, U2AF1, or ZRSR2). ES, enrichment score; FDR, false discovery rate; NES, normalized enrichment score; WT, wild-type.

