. 2021 Oct 6;12(2):522–541. doi: 10.1158/2159-8290.CD-20-1513

Figure 5.

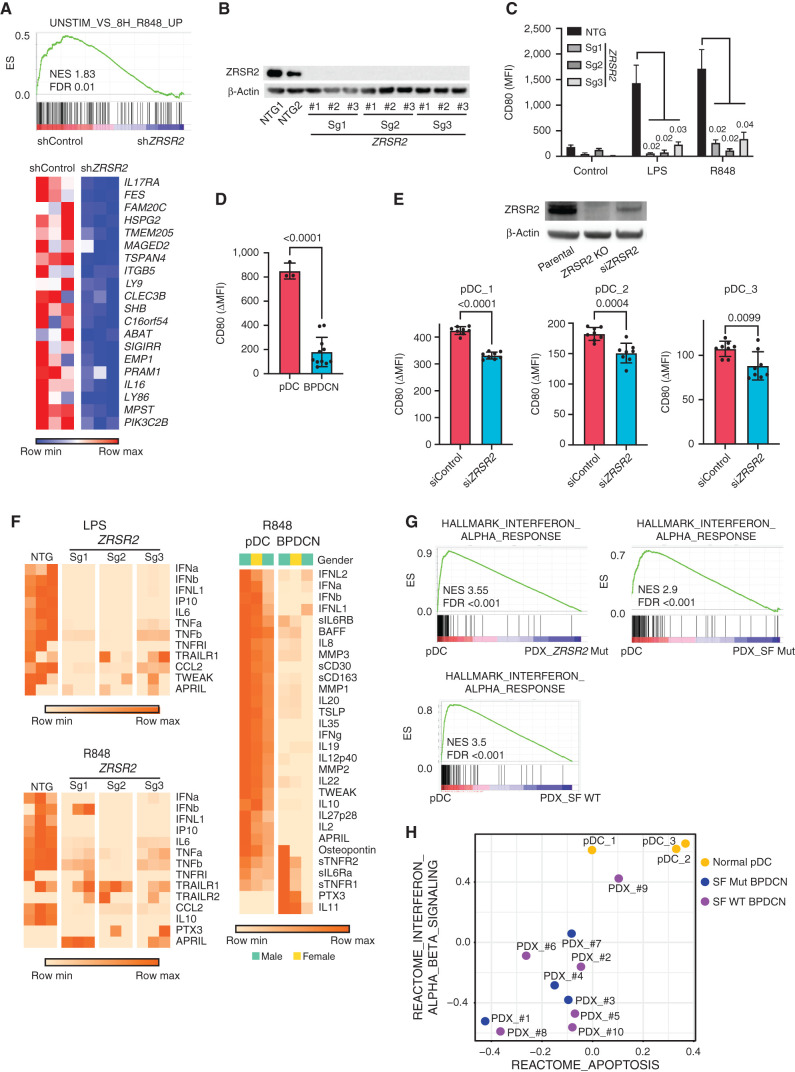
Figure 5. pDC activation by TLR stimulation is impaired by loss of ZRSR2 and in BPDCN. A, GSEA of RNA-seq showing decreased enrichment of TLR7 (R848) stimulated genes in ZRSR2 knockdown cells (shZRSR2 versus shControl CAL1 cells, each after 7 days of doxycycline shRNA induction; n = 3 per condition). Heat map shows expression levels of the leading-edge genes in GSEA from blue (low) to red (high). B, Western blot for ZRSR2 and β-actin in control or ZRSR2 knockout CAL1 cells. NTG1 and NTG2 are independent nontargeting sgRNAs, and Sg1, Sg2, and Sg3 are independent ZRSR2-targeted sgRNAs, each assessed in biological triplicate samples. C, Mean fluorescence intensity (MFI) of cell surface CD80 on control or ZRSR2 knockout CAL1 cells is shown after stimulation with either LPS or R848 (n = 3 biological replicates of each sgRNA, groups compared by t test). D, CD80 upregulation (ΔMFI; MFI stimulated-unstimulated) 24 hours after R848 stimulation in three sets of independent normal donor-purified pDCs and in 11 primary BPDCN PDXs, with groups compared by t test. E, Top, Western blot for ZRSR2 and β-actin in parental CAL1 cells and in CAL1 cells with CRISPR knockout (ZRSR2 KO) or transient knockdown (siZRSR2) of ZRSR2. Bottom, CD80 upregulation after R848 treatment in primary pDCs from three independent healthy donors (pDC_1–3) each with seven to nine biological replicates each transfected with control or ZRSR2 siRNAs, with groups compared by t test. F, Heat maps showing protein quantitation of the indicated cytokines in supernatants of control or ZRSR2 knockout CAL1 cells (n = 3 independent biological replicates of each sgRNA, nontargeting or ZRSR2 targeting) and normal pDCs or BPDCN PDXs (each column is from an independent individual donor or PDX) after stimulation with LPS or R848. BPDCN genotypes, left to right: splicing factor wild-type, splicing factor wild-type, ZRSR2 mutant. G, GSEA of RNA-seq from R848-stimulated normal human pDCs or primary BPDCN PDXs that were ZRSR2 mutated (ZRSR2 Mut), any splicing factor mutated (SF Mut), or without known splicing factor mutation (SF WT). H, Bubble plot of enrichment scores from gene set variation analysis (GSVA) for the indicated type 1 interferon and apoptosis signatures from RNA-seq in normal pDCs (yellow) and BPDCN PDXs (blue, splicing factor mutated; purple, splicing factor wild-type) after treatment with R848.

pDC activation by TLR stimulation is impaired by loss of ZRSR2 and in BPDCN. A, GSEA of RNA-seq showing decreased enrichment of TLR7 (R848) stimulated genes in ZRSR2 knockdown cells (shZRSR2 versus shControl CAL1 cells, each after 7 days of doxycycline shRNA induction; n = 3 per condition). Heat map shows expression levels of the leading-edge genes in GSEA from blue (low) to red (high). B, Western blot for ZRSR2 and β-actin in control or ZRSR2 knockout CAL1 cells. NTG1 and NTG2 are independent nontargeting sgRNAs, and Sg1, Sg2, and Sg3 are independent ZRSR2-targeted sgRNAs, each assessed in biological triplicate samples. C, Mean fluorescence intensity (MFI) of cell surface CD80 on control or ZRSR2 knockout CAL1 cells is shown after stimulation with either LPS or R848 (n = 3 biological replicates of each sgRNA, groups compared by t test). D, CD80 upregulation (ΔMFI; MFI stimulated-unstimulated) 24 hours after R848 stimulation in three sets of independent normal donor-purified pDCs and in 11 primary BPDCN PDXs, with groups compared by t test. E, Top, Western blot for ZRSR2 and β-actin in parental CAL1 cells and in CAL1 cells with CRISPR knockout (ZRSR2 KO) or transient knockdown (siZRSR2) of ZRSR2. Bottom, CD80 upregulation after R848 treatment in primary pDCs from three independent healthy donors (pDC_1–3) each with seven to nine biological replicates each transfected with control or ZRSR2 siRNAs, with groups compared by t test. F, Heat maps showing protein quantitation of the indicated cytokines in supernatants of control or ZRSR2 knockout CAL1 cells (n = 3 independent biological replicates of each sgRNA, nontargeting or ZRSR2 targeting) and normal pDCs or BPDCN PDXs (each column is from an independent individual donor or PDX) after stimulation with LPS or R848. BPDCN genotypes, left to right: splicing factor wild-type, splicing factor wild-type, ZRSR2 mutant. G, GSEA of RNA-seq from R848-stimulated normal human pDCs or primary BPDCN PDXs that were ZRSR2 mutated (ZRSR2 Mut), any splicing factor mutated (SF Mut), or without known splicing factor mutation (SF WT). H, Bubble plot of enrichment scores from gene set variation analysis (GSVA) for the indicated type 1 interferon and apoptosis signatures from RNA-seq in normal pDCs (yellow) and BPDCN PDXs (blue, splicing factor mutated; purple, splicing factor wild-type) after treatment with R848.