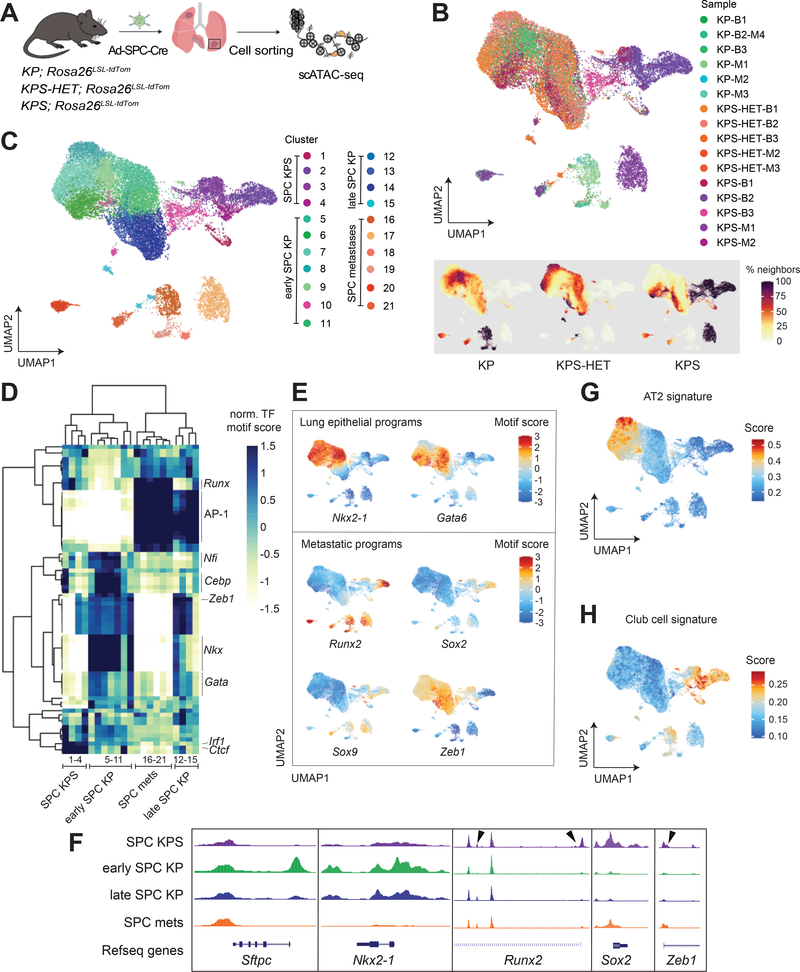
Figure 2. Epigenetic states in Smarca4-deficient primary tumors resemble metastases.
(A) Schematic diagram of the experimental strategy to isolate cancer cells from moribund animals for scATAC-seq. (B) UMAP visualization of single-cell chromatin accessibility profiles of 25,229 cells isolated from primary tumors (bulk) and metastases (met) of KP (bulk n=3; met n=4), KPS-HET (bulk n=3; met n=2), and KPS (bulk n=3; met n=2) animals colored by sample where B = bulk primary tumors and M = metastasis (upper panel), and by % of cell neighbors per genotype (lower panel). (C) UMAP visualization of single-cell chromatin accessibility profiles colored by cluster. (D) A heatmap showing the top variable accessible motifs across the dataset. Heatmap is colored by row-normalized mean motif scores of each cell cluster identified through the Louvain modularity method. (E) UMAP visualization of the scATAC-seq dataset colored by lung lineage and metastatic program motif scores. (F) Aggregated scATAC-seq tracks showing selected chromatin accessibility peaks per group. Arrows show gains of peaks in SPC KPS clusters. UMAP visualization of dataset colored by (G) AT2 and (H) club cell signature gene scores.

