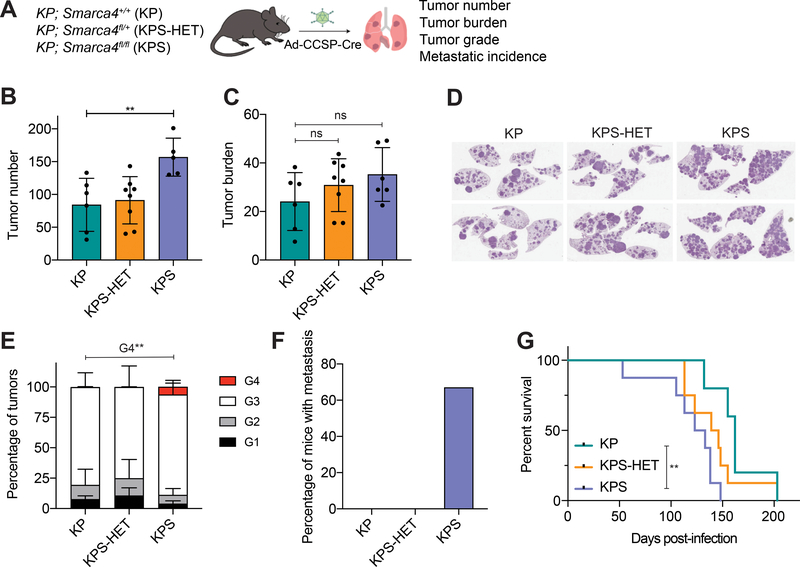
Figure 3. Smarca4 inactivation in tumor-initiating CCSP+ cells accelerates tumor progression.
(A) Schematic diagram of the experimental strategy of tumor initiation in CCSP-expressing cells in the lungs of KP (n=6), KPS-HET (n=8), and KPS (n=6) animals using adenoviral CCSP-Cre (Ad-CCSP-Cre), and subsequent analysis 16 weeks post-infection. (B) Quantification of tumor number (number of tumors per mouse) in KP (n=6), KPS-HET (n=8), and KPS (n=5) animals 16 weeks post-infection. Data are mean ± s.d. One-way ANOVA: F(2, 16) = 6.786, p = 0.0073; Dunnett’s multiple comparisons test: **adjusted p-value = 0.0078. (C) Quantification of tumor burden (% tumor area/lung area per mouse) in KP (n=6), KPS-HET (n=8), and KPS (n=6) animals 16 weeks post-infection. Data are mean ± s.d.; one-way ANOVA: not significant (ns). (D) Representative H&E staining of tumor-bearing lungs of KP, KPS-HET, and KPS animals 16 weeks post-infection. (E) Distribution of histological tumor grades (% tumor grade area/total tumor area where G1 = Grade 1, G2 = Grade 2, G3 = Grade 3 and G4 = Grade 4) in KP (n=6), KPS-HET (n=8), and KPS (n=6) animals 16 weeks post-infection. Data are mean ± s.d.; one-way ANOVA (G4): F(2, 17) = 9.102, p = 0.0021; Dunnett’s multiple comparisons test: **adjusted p-value = 0.0044. (F) Percentage of KP (n=6), KPS-HET (n=8), and KPS (n=6) mice with metastasis 16 weeks post-infection. Chi-square: p = 0.0029. (G) Survival curves of KP (n=5), KPS-HET (n=8), and KPS (n=8) animals infected with Ad-CCSP-Cre through intratracheal instillation. Log-rank test (KP vs KPS): **p = 0.0086.

