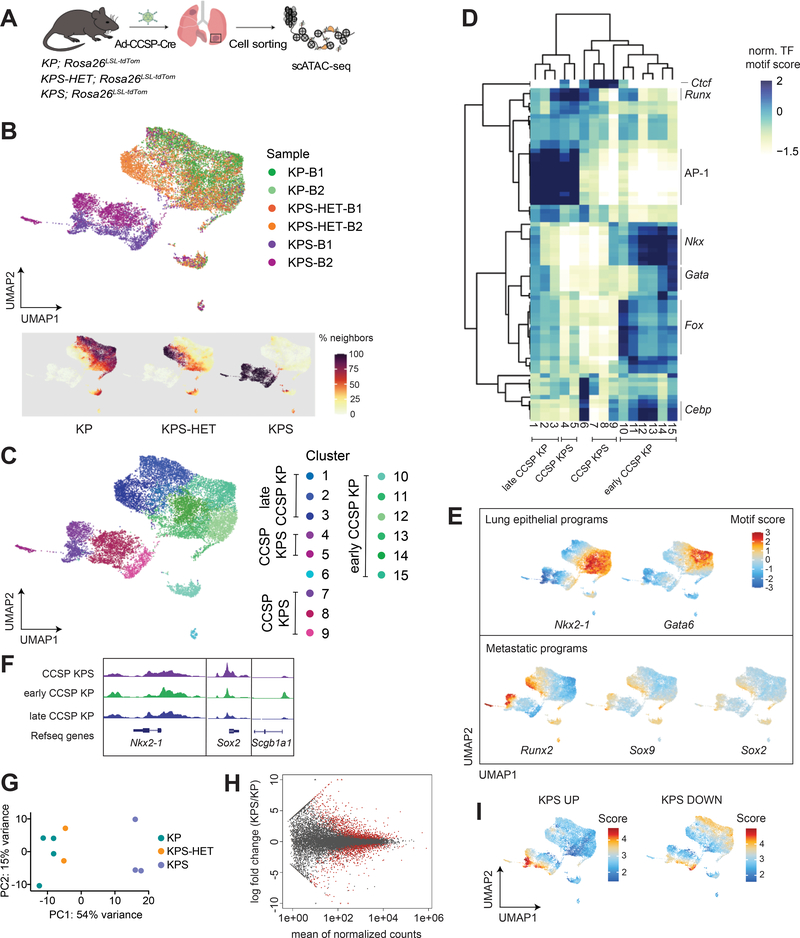
Figure 4. The epigenetic states of Smarca4-deficient primary tumors are driven by SMARCA4 loss.
(A) Schematic diagram of the experimental strategy to isolate cancer cells from moribund animals for scATAC-seq. (B) UMAP visualization of single-cell chromatin accessibility profiles of 16,321 cells isolated from primary tumors of KP (n=2), KPS-HET (n=2), and KPS (n=2) animals colored by sample where B = bulk primary tumors (upper panel) and by % of cell neighbors per genotype (lower panel). (C) UMAP visualization of scATAC-seq profiles colored by cluster. (D) A heatmap showing the top variable accessible motifs across the dataset. Heatmap is colored by row-normalized mean motif scores of each cell cluster identified through the Louvain modularity method. (E) UMAP visualization of the scATAC-seq dataset colored by lung lineage and metastatic program motif scores. (F) Aggregated scATAC-seq tracks showing selected chromatin accessibility peaks per group. (G) Principal component analysis (PCA) of RNA-seq data generated from KP (n=4), KPS-HET (n=2), and KPS (n=3) primary tumors. (H) MA plot showing differentially expressed genes between KP (n=4) and KPS (n=3) primary tumors. Red dots represent differentially enriched genes (adjusted p-value < 0.05). (I) UMAP visualization of the CCSP scATAC-seq dataset colored by the mean gene score of differential genes increased and decreased (adjusted p-value < 0.05, |FC|>1.5) in KPS primary tumors (n=3) compared to KP (n=4) primary tumors.

