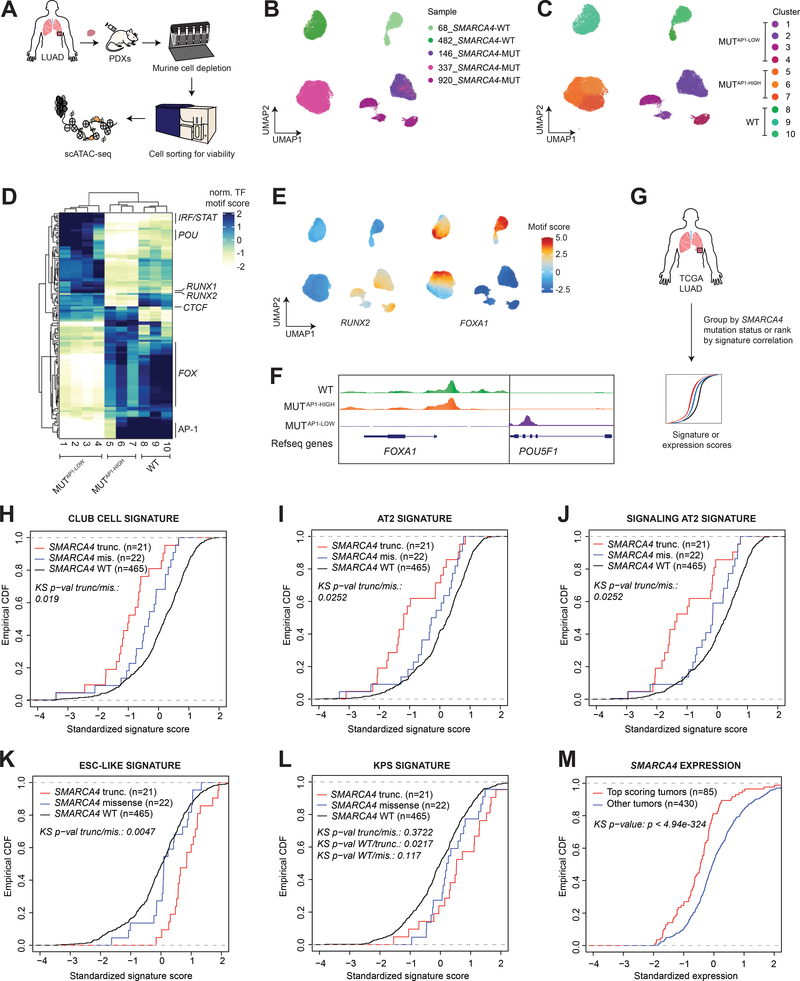
Figure 6. Human SMARCA4-mutant LUAD recapitulates key features of the murine model.
(A) Workflow of the experimental strategy to isolate cancer cells from SMARCA4 wild-type (n=2) and mutant (n=3) LUAD PDX models for scATAC-seq. UMAP projection of scATAC-seq profiles of 30,992 cancer cells colored by (B) sample and (C) cluster. (D) A heatmap showing the top variable accessible motifs across the dataset. Heatmap is colored by row-normalized mean motif scores of each cell cluster identified through the Louvain modularity method. (E) UMAP projection of scATAC-seq dataset colored by RUNX2 and FOXA1 motif scores (F) Aggregated scATAC-seq tracks showing marker chromatin accessibility peaks per group. (G) Schematic diagram of TCGA LUAD analyses. Empirical cumulative distribution function (CDF) plot of standardized 10x club cell (H), 10x AT2 (I), 10x signaling AT2 (J), ESC-like (K), and KPS (L) signature scores in TCGA LUAD patients with intact SMARCA4 (WT), SMARCA4 truncating mutations, and SMARCA4 missense mutations. (M) Empirical CDF plot comparing standardized SMARCA4 expression between top-scoring TCGA LUAD correlated with the KPS signature (z score > 1) and the rest of the cohort.

