. 2021 Sep 22;12(2):542–561. doi: 10.1158/2159-8290.CD-20-1826

Figure 2.

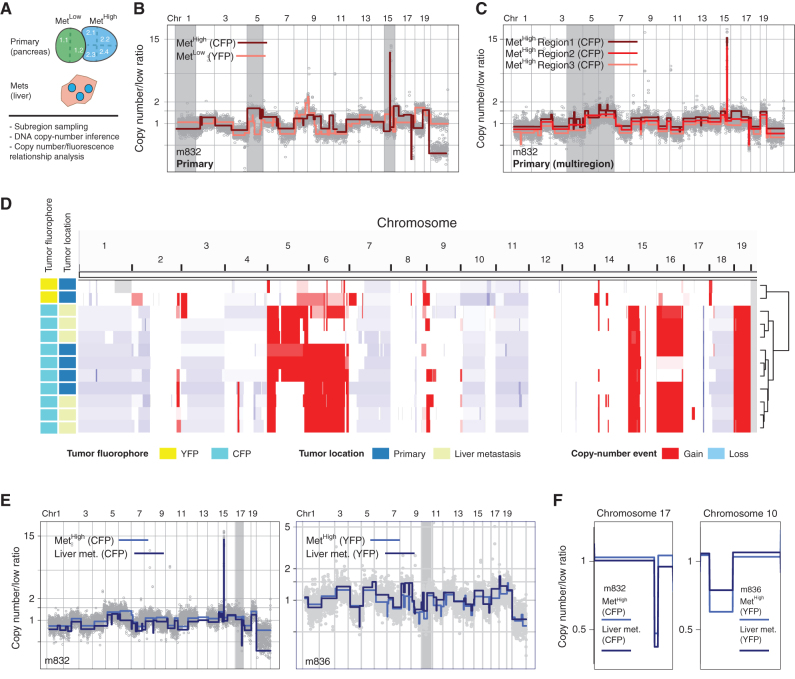
Figure 2. SCNA analysis confirms fluorescence-based lineage relationships and reveals genetic heterogeneity in paired primary pancreatic tumors and liver metastases. A, Schematic representation of KPCXY pancreatic tumor and matching liver metastases with multiregion sampling for copy-number sequence analysis. B, Representative genome-wide copy-number profiles of MetHigh (CFP+ fluorescence) and MetLow (YFP+ fluorescence) tumors from mouse 832 (m832) as depicted in Fig. 1E. Gray shading denotes alterations that are unique to the MetHigh (CFP+) tumor. The y-axis illustrates normalized read count values (low ratio), which are directly proportional to genome copy number at a given chromosomal location. The copy-number profiles are centered around a mean of 1 with gains and deletions called for segments with values higher and lower than the mean, respectively (Methods). C, Representative genome-wide copy-number profiles of three subsampled tissue regions of the MetHigh (CFP+) primary tumor from m832. Gray shading denotes alterations that are found heterogeneously from multiregion sequencing of the primary tumor. D, Genome-wide heat map with hierarchical clustering based on copy-number alterations of matched primary and metastatic samples profiled from m832. E, Representative genome-wide copy-number profiles of fluorescently matched primary and metastatic tissue from two profiled mice (m832, left; m836, right), illustrating the shared clonal genetic lineage. F, Zoomed-in chromosomal views of copy-number alterations with distinguishing breakpoint patterns supporting shared genetic lineage. Panels are ordered as in E.

SCNA analysis confirms fluorescence-based lineage relationships and reveals genetic heterogeneity in paired primary pancreatic tumors and liver metastases. A, Schematic representation of KPCXY pancreatic tumor and matching liver metastases with multiregion sampling for copy-number sequence analysis. B, Representative genome-wide copy-number profiles of MetHigh (CFP+ fluorescence) and MetLow (YFP+ fluorescence) tumors from mouse 832 (m832) as depicted in Fig. 1E. Gray shading denotes alterations that are unique to the MetHigh (CFP+) tumor. The y-axis illustrates normalized read count values (low ratio), which are directly proportional to genome copy number at a given chromosomal location. The copy-number profiles are centered around a mean of 1 with gains and deletions called for segments with values higher and lower than the mean, respectively (Methods). C, Representative genome-wide copy-number profiles of three subsampled tissue regions of the MetHigh (CFP+) primary tumor from m832. Gray shading denotes alterations that are found heterogeneously from multiregion sequencing of the primary tumor. D, Genome-wide heat map with hierarchical clustering based on copy-number alterations of matched primary and metastatic samples profiled from m832. E, Representative genome-wide copy-number profiles of fluorescently matched primary and metastatic tissue from two profiled mice (m832, left; m836, right), illustrating the shared clonal genetic lineage. F, Zoomed-in chromosomal views of copy-number alterations with distinguishing breakpoint patterns supporting shared genetic lineage. Panels are ordered as in E.