Figure 5.
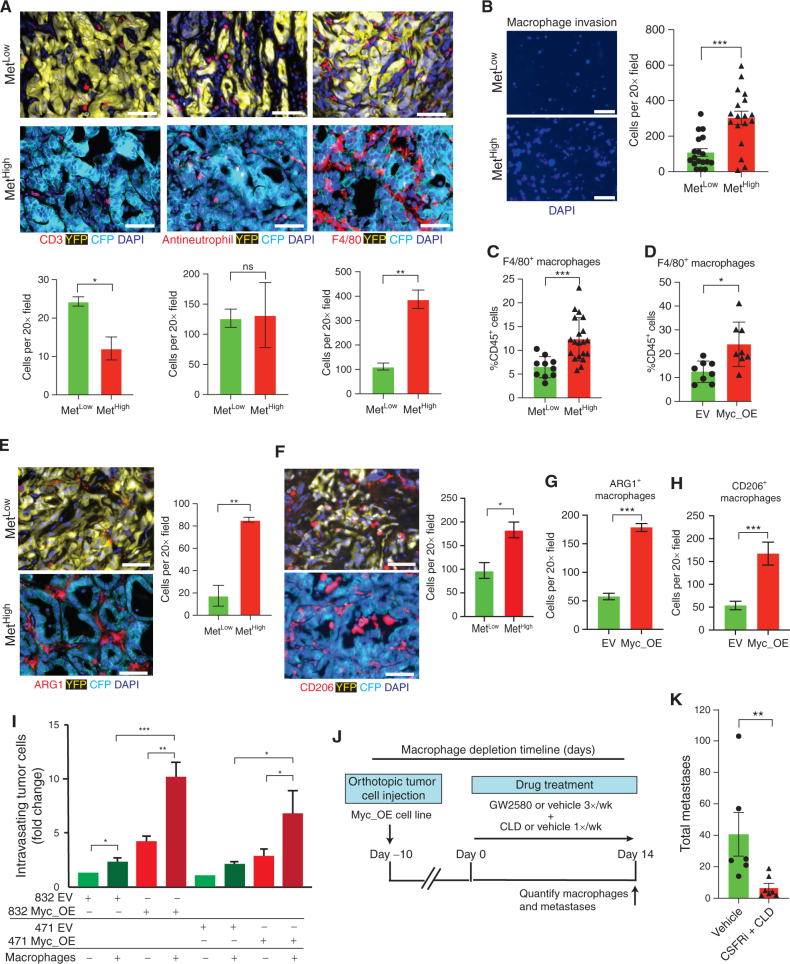
MYC recruits prometastatic macrophages to the tumor microenvironment. A, Representative immunofluorescence images (top) and quantification (bottom) of T cells (CD3+), neutrophils (antineutrophil antibody+), and macrophages (F4/80+) in primary KPCXY tumors categorized as MetLow or MetHigh, with quantification below (n = 3 mice for each subgroup and four to five random fields of view analyzed). B, Representative immunofluorescence images (left) and quantification (right) of macrophages that have migrated across a transwell filter following coculture with MetHigh or MetLow tumor cells (n = 2 MetLow and n = 2 MetHigh cell lines used; three replicates per cell line with three 20× images taken per transwell; each dot represents quantification of an independent image). C, Quantification of tumor-infiltrating macrophages (as a percentage of total CD45+ cells) in MetLow or MetHigh subcutaneous tumors assessed by flow cytometry (n = 5 MetHigh cell lines and n = 3 MetLow cell lines; two NOD.SCID mice examined per cell line with two tumors per mouse; each dot represents an independent tumor). D, Quantification of tumor-infiltrating macrophages (as a percentage of total CD45+ cells) in Myc_OE or control (EV) subcutaneous tumors assessed by flow cytometry (n = 2 Myc_OE cell lines and n = 2 EV cell lines; two NOD.SCID mice examined per cell line with two tumors per mouse; each dot represents an independent tumor). E and F, Representative immunofluorescence images (left) and quantification (right) of Arg1+ (E) and CD206+ (F) TAMs in primary KPCXY tumors categorized as MetLow or MetHigh (n = 3 mice for each subgroup and four to five random fields of view analyzed). G and H, Quantification of Arg1+ (G) and CD206+ (H) TAMs in primary MYC_OE or control (EV) orthotopic tumors assessd by immunflourescence staining (n = 2 Myc_OE cell lines and n = 2 EV cell lines; two NOD.SCID mice examined per cell line; four to five random fields of view analyzed). I, Quantification of tumor cell intravasation from an iTEM assay. MYC_OE– or EV-transduced tumor cells were cultured in transwell filters seeded with an endothelial cell monolayer in the presence or absence of macrophages (see Methods). Tumor cells that traversed the endothelial layer were quantified and normalized to the EV control in the absence of macrophages for each of two MetLow tumor lines. J, Schematic outline of the macrophage depletion experiment. Mice were orthotopically implanted with Myc_OE cells (n = 2 independent cell lines), and after 10 days, tumor-bearing animals were treated with a combination of colony-stimulating factor receptor inhibitor (CSFRi; GW2580) and liposomal clodronate (CLD) or vehicle. Metastases were quantified 14 days later. K, Quantification of total metastases (liver and lung) following the macrophage depletion strategy outlined in J (n = 6 control mice and n = 7 GW2580 + CLD mice; each dot represents an independent mouse). Statistical analysis (A–H and K) by Student unpaired t test with significance indicated (*, P < 0.05; **, P < 0.005; ***, P < 0.0001; ns, not significant); statistical analysis (I) by two-way ANOVA (*, P < 0.05; **, P < 0.01; ***, P < 0.001). Error bars indicate SEM. Scale bars, 10 μm (A, E, and F) and 50 μm (B).

