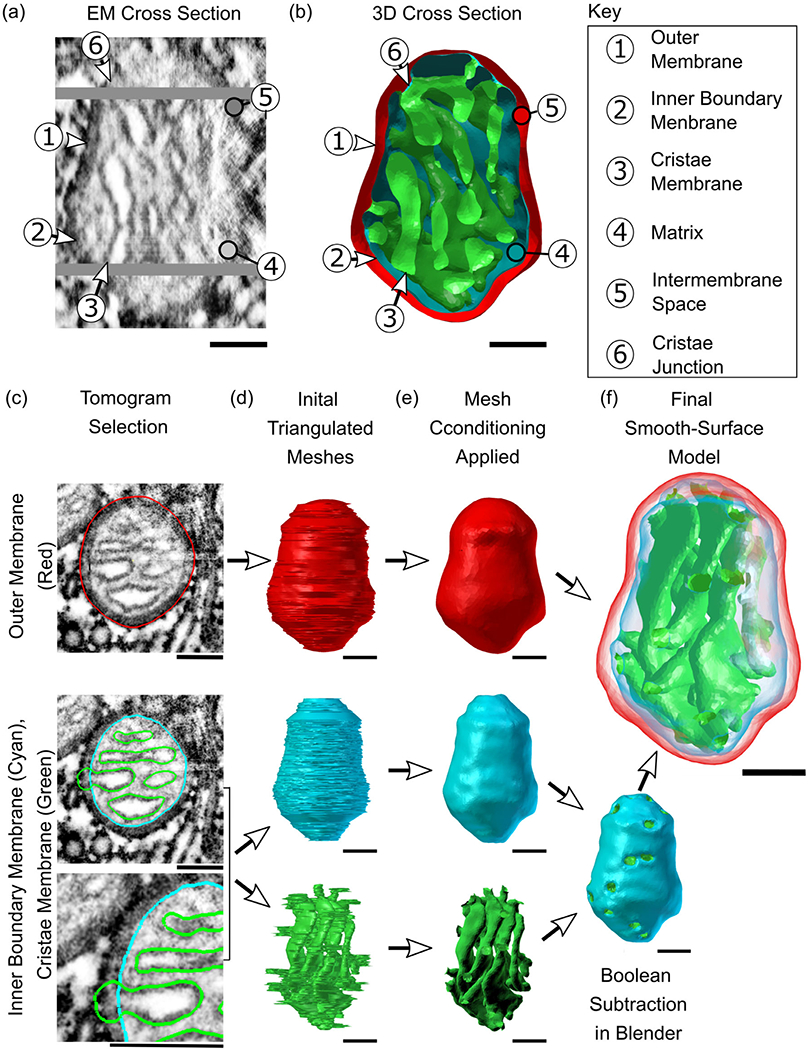
FIGURE 1.

From high-resolution 2D representations of mitochondria to high-quality 3D reconstructions. (a and b) Serial electron tomographic images of mouse cerebellum neuropil at an isotropic voxel size of 1.64 nm are used to reconstruct the two lipid bilayer membranes of a mitochondrion, exemplified here with reconstruction #12. One specific EM cross section is shown here, highlighting the physical section in the tomogram and its associated 3D cross section reconstruction. The spatial organization of these membranes generates a number of compartments and submembrane regions specified here. (c)The hand-traced contours used in the reconstructions are shown overlayed on a cutout from the respective tomographic image. These three overlays show traces of the three membrane structures; the outer membrane (OM, in red), inner boundary membrane (IBM, in cyan), and cristae membrane (CM, in green). Although the inner membrane (IM) is a single structure comprised of the IBM and CM, these two components are treated as separate objects and are combined later. (d)The 3D reconstructions of the membranes are created using the program Contour Tiler (Edwards et al., 2014). Jaggedness in the model’s surface was found to be due to noise resulting from human tracing error. (e) The noise is smoothed out using GAMer 2 mesh conditioning operations (Lee, Laughlin, Moody, et al., 2020) to create the smooth-surface models shown here. The IBM and CM have been joined into one object via Boolean subtraction. (f) Meshes are made transparent and shown together. All scale bars: 100 nm.
