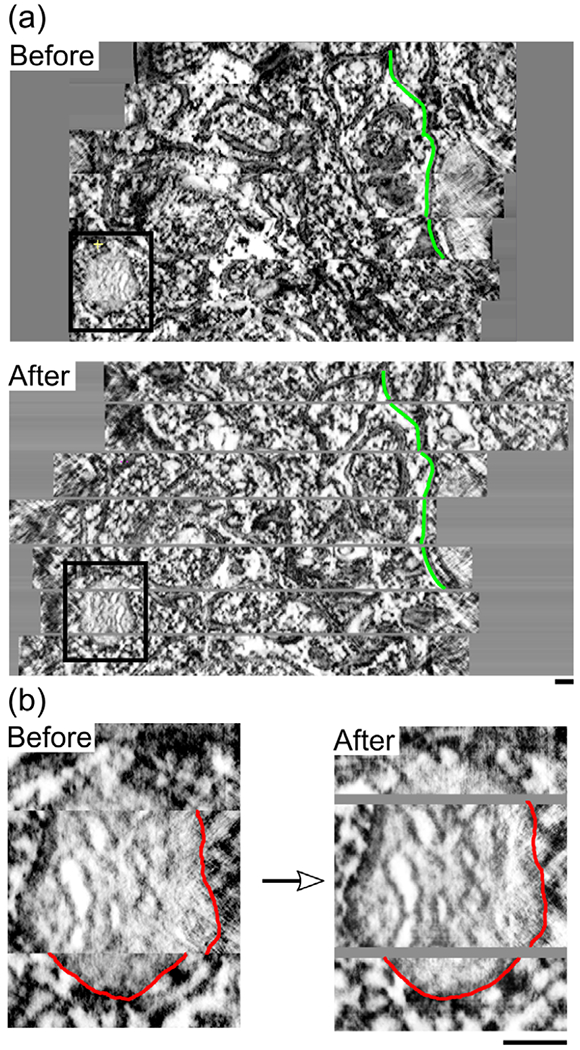
FIGURE 2.

Alignment and gap insertion. (a) A side view of all sections in the Data set 1 image stack compiled perpendicular to the tomographic sections with spacing of 1.64 nm between tomographs. The stack is shown before and after alignment with SWiFT-IR and the addition of appropriate spacing to account for gaps between physical sections. Spacing of 16.4 nm is added at each gap. In green is a single membrane feature traced on each image for comparison. The black box indicates the mitochondrion shown in Figure 1. (b) A closeup to this organelle with a section of outer membrane traced in red to demonstrate improved continuity across sections after alignment and gap insertion.
