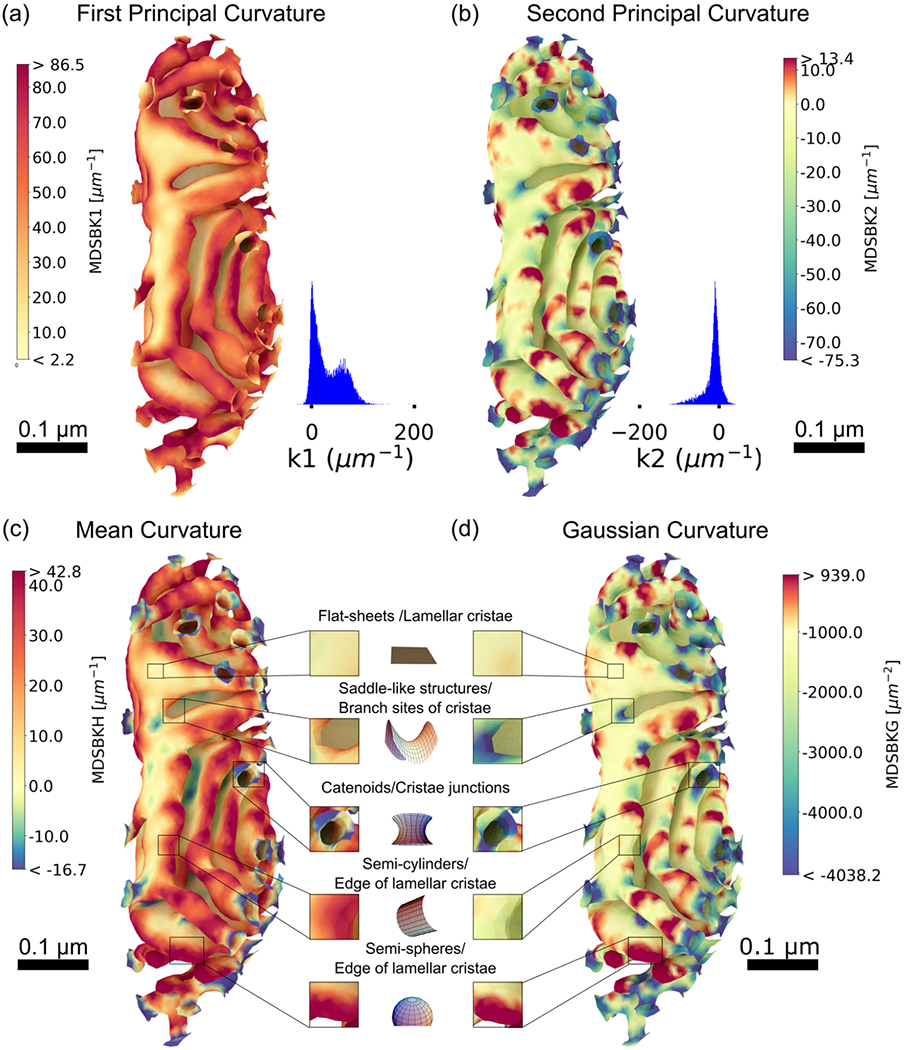
FIGURE 8.

Curvature analysis of the inner membrane of reconstruction # 1. (a) Curvature heat map of the first principal curvature k1, representing the maximum curvature at each vertex in the mesh (only the cristae membrane is represented), for values between the 5th and 95th percentiles, and their respective distribution values. The distribution of k1 is mostly positive, with the highest values found at cristae junctions, the connection site between cristae, branch sites of cristae, at the edge of lamellar cristae, and along the length in tubular cristae. (b) Curvature heat map of the second principal curvature k2, corresponding to the minimum curvature at each vertex in the mesh, for values between the 5th and 95th percentiles. The distribution of k2 is mostly negative, and particularly high at cristae junctions, connections between cristae, and at the branch sites of cristae, complementing the high-positive curvature k1 as expected for minimal surfaces. (c) Heat map of the mean curvature, corresponding to the average value of the first k1 and second curvature k2, for values between the 5th and 95th percentiles. (d) Heat map of the Gaussian curvature, corresponding to the product of first and second curvatures, for values between the 5th and 95th percentiles. Four characteristic structural motifs emerged in the cristae membrane: flat-sheets are in lamellar cristae with mean and Gaussian curvatures approximately zero; saddle-like structures with zero mean and nonzero Gaussian curvature are at cristae junctions and branch sites of cristae; at the edge of lamellar cristae, we found two characteristic shapes: semi-spherical like shapes with nonzero mean and Gaussian curvature and semi-cylindrical shapes with nonzero mean and zero Gaussian curvature. Curvatures were calculated with the MDSB algorithm implemented in GAMer 2. Color bars represent values of the curvatures in units of μm−2 for the Gaussian curvature and μm−1 for all the rest. Scale bars 0.1 μm. Structural motif representations were generated with different notebooks from MathWorld (Weisstein, 2008, 2013, 2014a, 2014b, 2015).
