
FIGURE 4: Each pore harbors only a small fraction of intralineage diversity.
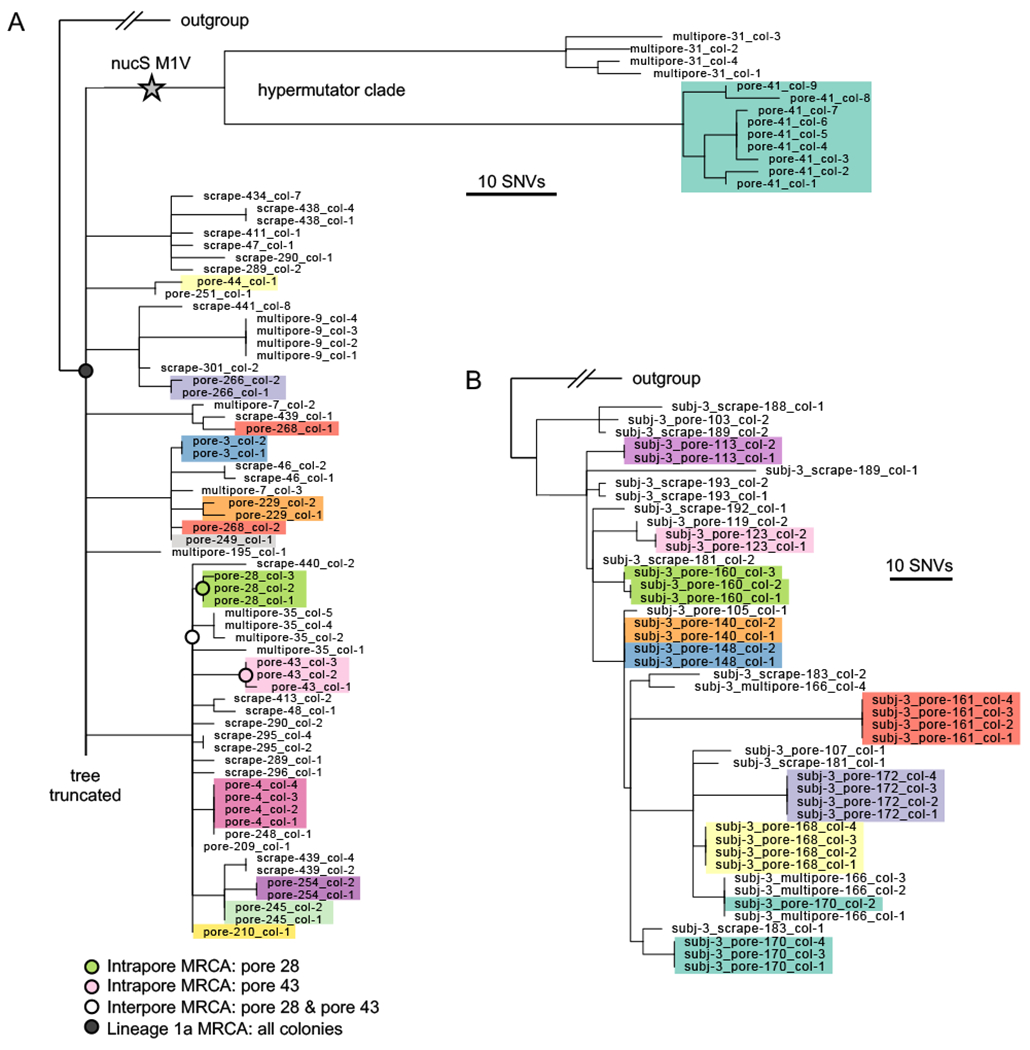
(A) Maximum parsimony tree of the most abundant lineage on Subject 1, Lineage 1a, in which each leaf represents a single colony. Colonies are colored by pore (excluding multipore samples and pore samples with only one colony), emphasizing low within-pore diversity. The long branches at the top of the phylogeny display a hypermutator phenotype (Figure S6). For any given non-hypermutator pore, the mean genetic distance of colonies to the pore’s inferred most recent common ancestor (MRCA) is usually less than 1 SNVs (median across pores: o SNVs; 25%-75% percentiles: 0 to 1.1 SNVs). Four example inferred ancestral genotypes are marked on the tree. Due to space limitations, the tree is truncated; see Figure S6 for the complete tree. (B) Maximum parsimony tree of the most abundant lineage on Subject 3, Lineage 3a. Additional lineage trees with individual pore samples highlighted are available in Figure S8.