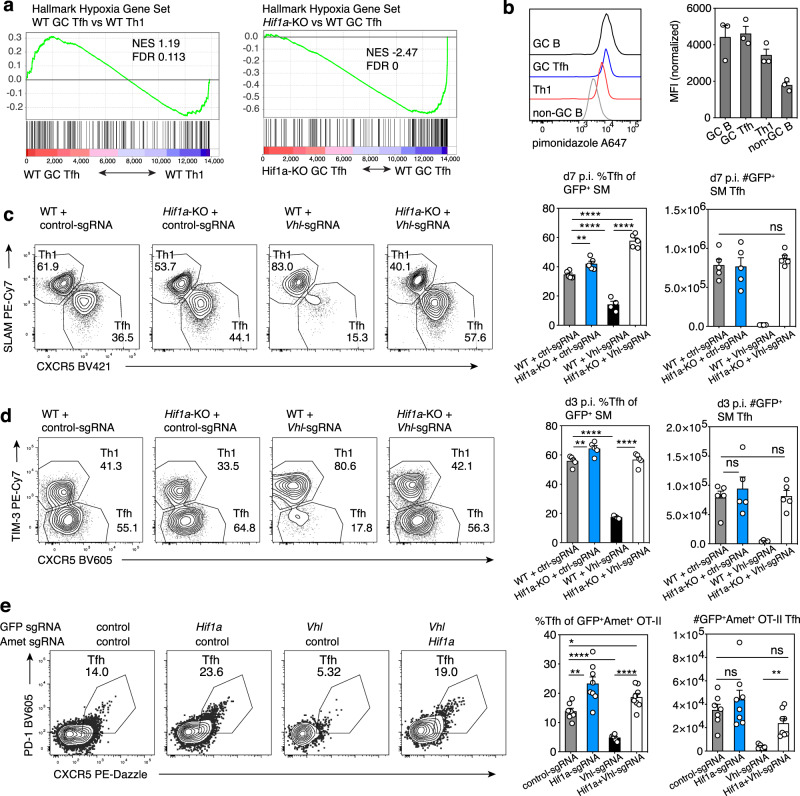
Fig. 3. Hypoxia and loss of VHL repress Tfh differentiation.
a GSEA analysis of “Hallmark Hypoxia” gene set in bulk RNA-seq data from WT or Hif1a-KO SMARTA cells transferred into WT hosts and sorted for Th1, pre-Tfh, and GC Tfh cell populations on d8 post-LCMV infection. NES, normalized enrichment score. b Pimonidazole staining of host B cells and WT SMARTA cells after transfer into WT hosts, on d8 post-LCMV infection. MFIs were normalized to cells from control hosts receiving WT SMARTA cells and saline injections, infected and processed in parallel. n = 3 pimonidazole-injected mice. c, d Representative flow plots, Tfh percentages and total Tfh cells from WT or Hif1a-KO Cas9+ GFP+ SMARTA cells transduced with control- or Vhl-sgRNA vector and transferred into WT hosts, on d6 (c) and d3 (d) post-LCMV infection, Vhl-sgRNA n = 4 mice, all other groups n = 5. e Representative flow plots, Tfh percentages and total Tfh cells from GFP+Ametrine+ Cas9+ OT-II cells after transduction with the indicated sgRNA vectors and transferred into WT hosts, on d6 post-immunization with NP-ovalbumin/alum, control-sgRNA n = 7, Hif1a-sgRNA n = 8, Vhl-sgRNA n = 5, Hif1a-sgRNA + Vhl-sgRNA n = 8. Data in (b–e) are presented as mean values +SEM. Representative data for (b–e) shown from 1 of at least 2 independent experiments. *p < 0.05; **p < 0.01, ***p < 0.001, ****p < 0.0001 as evaluated by two-tailed unpaired Student’s t test (c–e). Source data provided in Source Data file and Supplementary Data 6.

