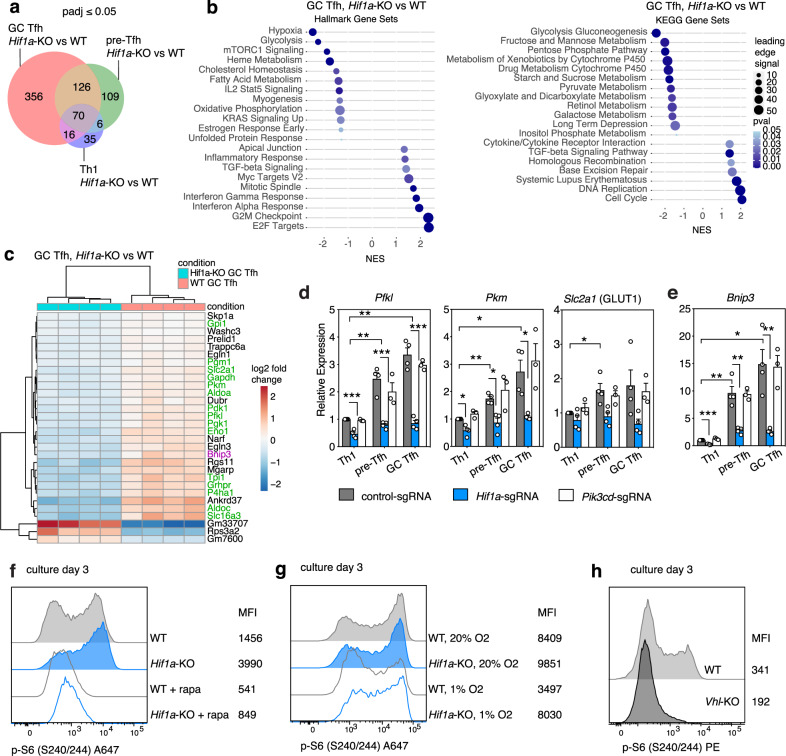
Fig. 4. HIF-1α-mediated gene expression changes reveal negative regulation of mTORC1.
a Venn diagram of differentially expressed genes from comparisons of Hif1a-KO and WT SMARTA Th1, pre-Tfh, and GC Tfh cell populations by bulk RNA-seq, on d8 post-LCMV. b GSEA analysis and c heatmap of differentially expressed genes from comparison of WT and Hif1a-KO SMARTA GC Tfh cells, on d8 post-LCMV. In (c), metabolic genes are highlighted in green, Bnip3 is highlighted in purple. d, e qRT-PCR of select glycolytic genes (d) and Bnip3 (e) mRNA in sorted p.i. SMARTA cells, as described in Fig. 2c. Data are pooled from N = 3–4 independent infection and sort experiments (control-sgRNA and Hif1a-sgRNA N = 4 experiments, Pik3cd-sgRNA N = 3). Data in (d, e) are presented as mean values +SEM. f Phospho-S6 (p-S6) staining in WT or Hif1a-KO SMARTA cells cultured under Tfh-like conditions, with or without rapamycin, on d3. g Phospho-S6 staining in WT or Hif1a-KO SMARTA cells cultured under Tfh-like conditions, under 20% or 1% O2, on d3. h Phospho-S6 staining in WT or Vhl-KO SMARTA cells cultured under Tfh-like conditions, on d3. Representative data for (f–h) shown from 1 of at least 2 independent experiments. Experimental details for (d, e) as described for Fig, 2c. *p < 0.05; **p < 0.01, ***p < 0.001 as evaluated by two-tailed unpaired Student’s t test (d-e). Source data provided in Source Data file and Supplementary Data 6.

