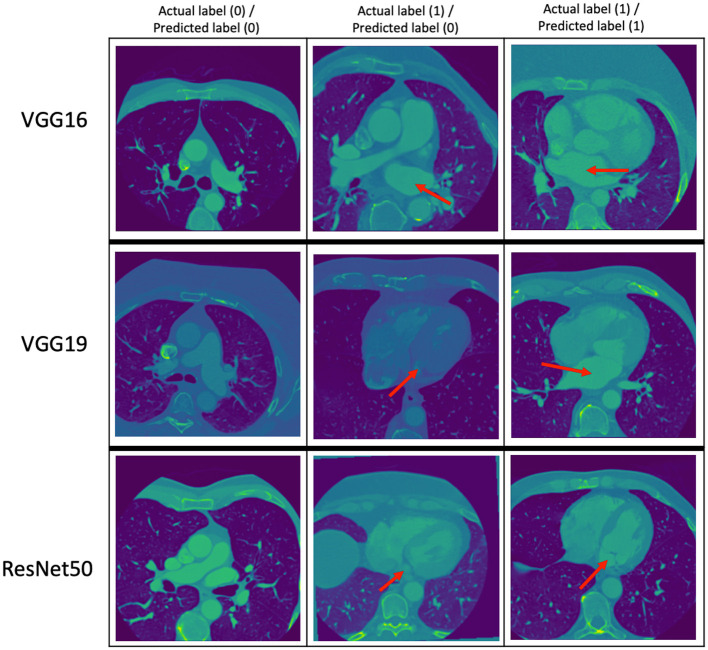
Figure 3.
Some examples of the prediction of the classification models. The top, middle, and bottom rows correspond to the predictions of the VGG16, VGG19, and ResNet50 models, respectively. The red arrows point to the LA. The middle column shows images with LA that the classification models got wrong.

