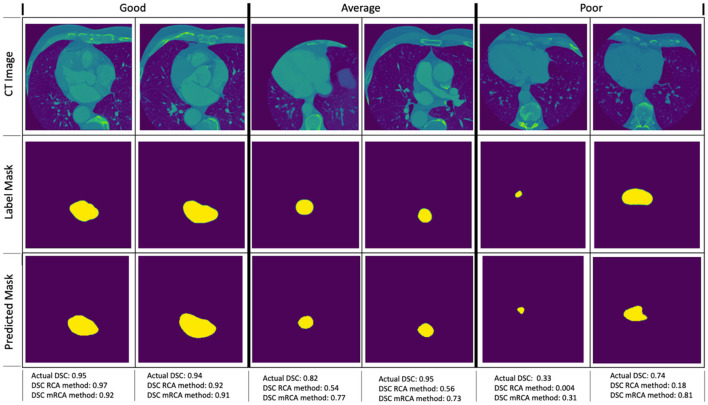
Figure 6.
Examples of image quality assessment comparing RCA and mRCA methods. The “Good” (η ∈ [0 0.2]), “Average” (η ∈ [0.2 0.5]), and “Poor” (η ∈ [0.5 1.0]) refer to the quality of the predictions of the RCA method when compared to the actual DSC scores in terms of the relative error (not shown on the figure), where relative error η = |(DSCactual − DSCpredicted)/DSCactual|).

