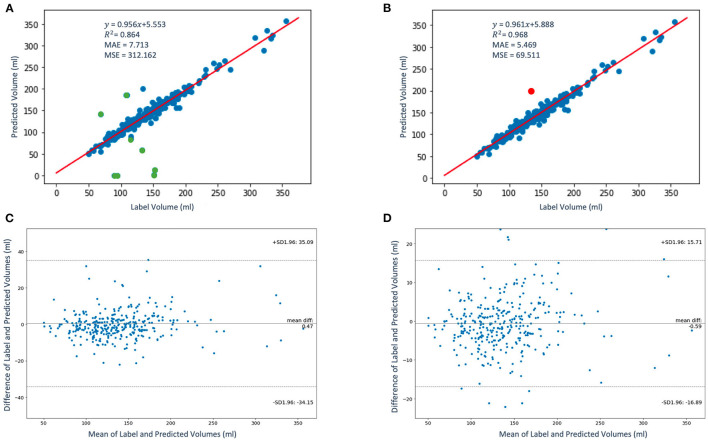
Figure 7.
The regression (A,B) and the Bland-Altman (C,D) plots of the label volumes vs. the predicted volumes using the proposed framework. The data points are shown in blue and green in panel (A); the green data points (9 out of 337) in the figure have been flagged by the QC condition as poor LAV estimates therefore eliminated in panel (B). The red data point in panel (B) indicates one poor volume estimate (out of a total of 10) was missed by the imposed condition. In panels (C,D), the upper and lower dashed horizontal lines represent the confidence interval at 95%.

