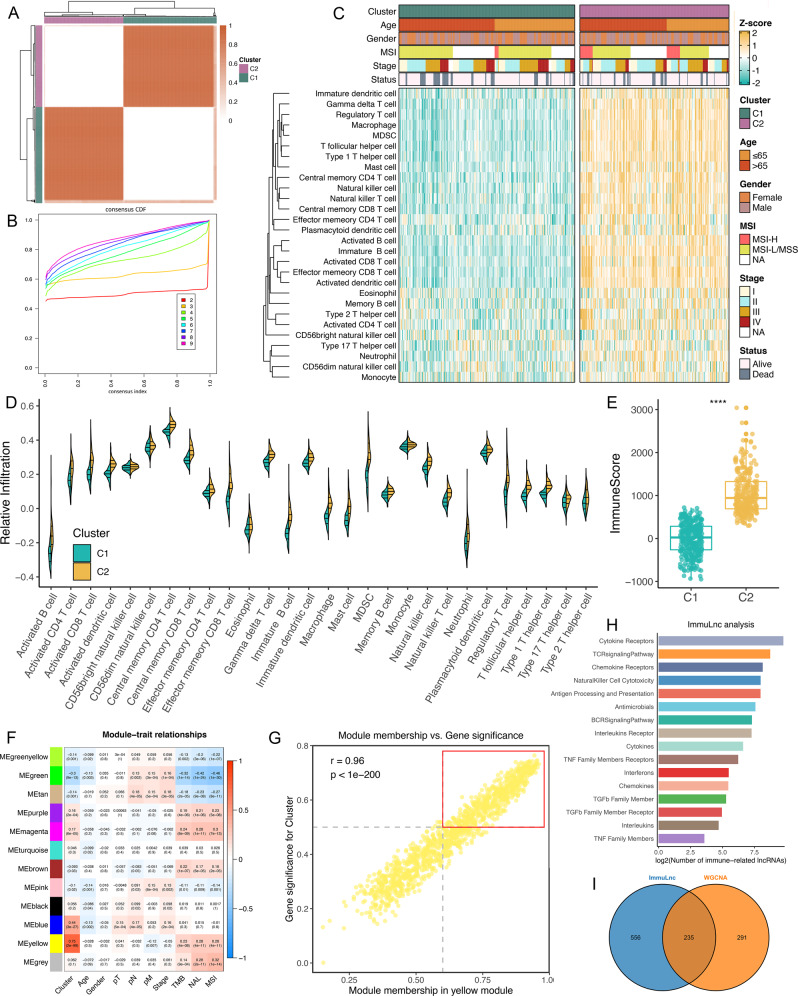
Fig. 1. Identification of immune-related lncRNAs via two algorithms.
A The consensus score matrix of all samples when k = 2. A higher consensus score between two samples indicates they are more likely to be grouped into the same cluster in different iterations. B The CDF curves of consensus matrix for each k (indicated by colours). C The infiltration abundance of 28 immune cell subsets evaluated by ssGSEA for two clusters. D The distribution of 28 immune cell subsets infiltration between two clusters. E The distribution of immune score inferred by ESTIMATE algorithm between two clusters in the TCGA-CRC cohort (n = 584, P = 5.22e−113). Statistic test: two-sided unpaired t test. In boxplot graphs centre line indicates median, bounds of box indicate 25th and 75th percentiles, and whiskers indicate minimum and maximum. ****P < 0.0001. F Correlation analysis between module eigengenes and clinical traits. G The high correlation between GS and MM in the yellow module (P = 0). Dots within the red rectangle were defined as immune-related lncRNAs, with both high GS and MM. Statistic test: Pearson’s correlation coefficient, two-sided unpaired t test. H ImmLnc identified a total of 791 lncRNAs significantly associated with immune‐related pathways. I The overleaping lncRNAs between WGCNA and ImmLnc.

